
IB Diploma · Biology · SL / HL · Theme A: Unity and Diversity
A4.2 Conservation of Biodiversity
Opens inside this page. Prefer your own PDF app? Open the PDF.
Full text of A4.2 Conservation of Biodiversity
IB DP BIOLOGY Theme A: Unity and Diversity A4.2 Conservation of Biodiversity
Revision Notes · Standard and Higher Level Fahad H. Ahmad
+92 323 509 4443 | Megalecture.com
Original notes prepared for the IB Diploma Programme Biology course (first assessment 2025)
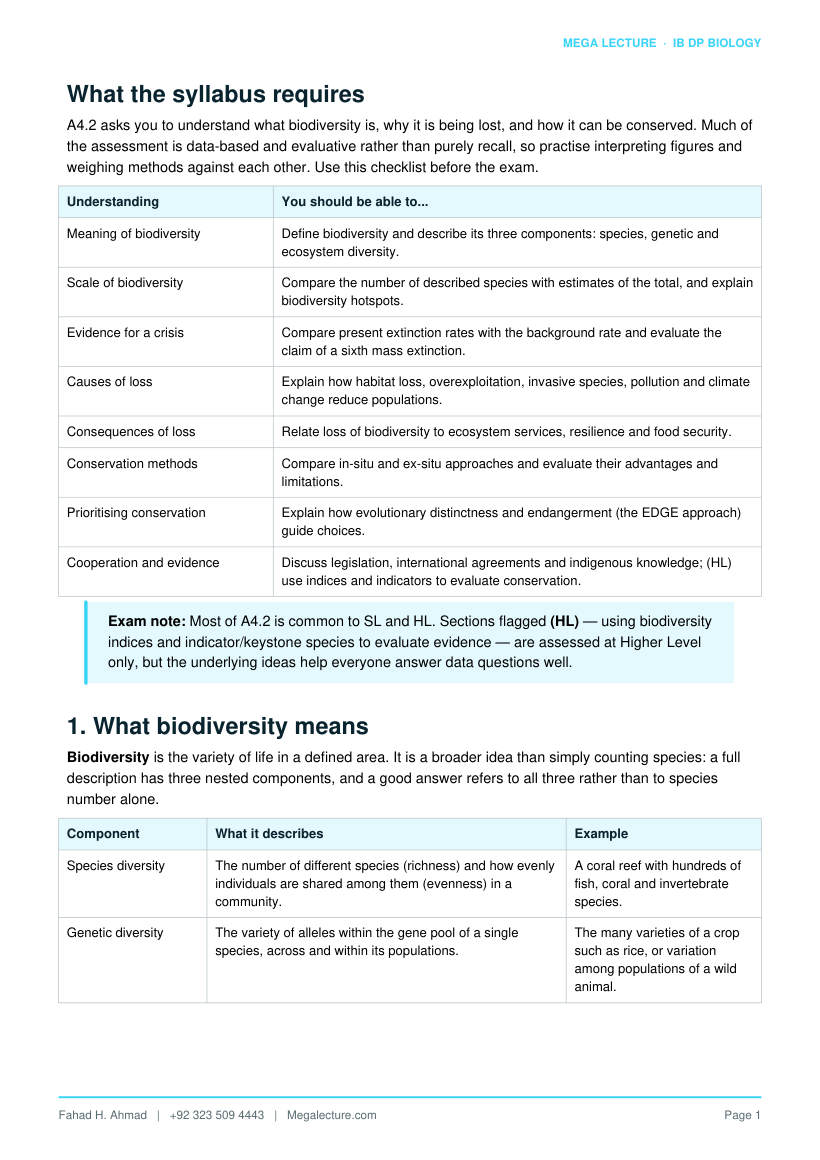
What the syllabus requires
A4.2 asks you to understand what biodiversity is, why it is being lost, and how it can be conserved. Much of the assessment is data-based and evaluative rather than purely recall, so practise interpreting figures and weighing methods against each other. Use this checklist before the exam.
Understanding You should be able to...
Meaning of biodiversity Define biodiversity and describe its three components: species, genetic and ecosystem diversity.
Scale of biodiversity Compare the number of described species with estimates of the total, and explain biodiversity hotspots.
Evidence for a crisis Compare present extinction rates with the background rate and evaluate the claim of a sixth mass extinction.
Causes of loss Explain how habitat loss, overexploitation, invasive species, pollution and climate change reduce populations.
Consequences of loss Relate loss of biodiversity to ecosystem services, resilience and food security.
Conservation methods Compare in-situ and ex-situ approaches and evaluate their advantages and limitations.
Prioritising conservation Explain how evolutionary distinctness and endangerment (the EDGE approach) guide choices.
Cooperation and evidence Discuss legislation, international agreements and indigenous knowledge; (HL) use indices and indicators to evaluate conservation.
Exam note: Most of A4.2 is common to SL and HL. Sections flagged (HL) — using biodiversity indices and indicator/keystone species to evaluate evidence — are assessed at Higher Level only, but the underlying ideas help everyone answer data questions well.
1. What biodiversity means
Biodiversity is the variety of life in a defined area. It is a broader idea than simply counting species: a full description has three nested components, and a good answer refers to all three rather than to species number alone.
Component What it describes Example
Species diversity The number of different species (richness) and how evenly individuals are shared among them (evenness) in a community.
A coral reef with hundreds of fish, coral and invertebrate species.
Genetic diversity The variety of alleles within the gene pool of a single species, across and within its populations.
The many varieties of a crop such as rice, or variation among populations of a wild animal.
Component What it describes Example
Ecosystem diversity The range of different habitats, communities and ecological processes across a region or the biosphere.
Forest, wetland, grassland and reef ecosystems within one landscape.
The three levels are linked. High genetic diversity within species buffers them against disease and environmental change; a variety of ecosystems supports a variety of species. Losing diversity at one level tends to erode the others.
Definitions to keep sharp: Richness = how many species are present. Evenness = how similar the population sizes are. A community dominated by one species has lower diversity than one with the same number of species spread evenly, even though the richness is identical.
2. The scale of biodiversity
Around 1.8 to 2.1 million species have been formally described (named and classified), yet estimates of the true total range widely — commonly from about 8 million to over 10 million eukaryote species, and far more if microorganisms are included. In other words, most species on Earth have not yet been discovered, so any figure for total biodiversity is an estimate carrying large uncertainty.
Why the numbers are so uncertain
- Many groups (insects, fungi, deep-sea and soil organisms, microbes) are poorly sampled.
- Species can be hard to delimit, and cryptic species look identical but are genetically distinct.
- Sampling effort is uneven: temperate, accessible regions are studied far more than the tropics.
- Estimates rely on extrapolation models, which give different totals depending on their assumptions.
Biodiversity hotspots
Biodiversity is distributed very unevenly. A biodiversity hotspot is a region with an exceptionally high number of species, a high proportion of endemic species (found nowhere else), that is also under serious threat of habitat loss. Hotspots such as tropical rainforests, Mediterranean-type shrublands and coral reefs cover a small fraction of Earth's surface but hold a disproportionate share of its species, so protecting them is an efficient conservation priority.
Exam tip: "Described" species are those formally named; the "estimated" total is much larger. If asked why estimates vary, cite under-sampling of the tropics and of small or hidden organisms, plus the difficulty of defining species boundaries — not just "we have not looked yet."
3. Evidence for a biodiversity crisis
Extinction is a natural process. The long-term background extinction rate inferred from the fossil record is very low — of the order of 1 species per million species per year. The concern is that current rates are estimated to be tens to hundreds (some studies say up to a thousand) times higher than this background level, and are rising.
Because this elevated rate of loss is comparable in scale to the five earlier mass-extinction events in Earth's history, many biologists describe the present period as a possible sixth mass extinction — with the key difference that its primary driver is a single species, humans, rather than an asteroid or volcanism.
Type of evidence What it shows
Recorded extinctions Documented losses of species since 1500 (e.g. dodo, passenger pigeon, thylacine) exceed the number expected from the background rate.
IUCN Red List assessments A large and growing fraction of assessed species are classed as threatened (Vulnerable, Endangered or Critically Endangered).
Population trend indices Indices tracking average vertebrate population sizes show steep declines over recent decades.
Habitat and range loss Satellite and survey data show shrinking forest cover, wetlands and reef area, predicting future extinctions.
Fossil-rate comparison Present rates greatly exceed the background rate calculated from the fossil record.
Caution with figures: Exact numbers vary between studies because both the background rate and the current rate are estimates with wide error margins. In an exam, state the direction and rough order of magnitude (current rate is far above background) rather than quoting a single precise multiplier as fact.
Figure 2. The worked estimate of 10 extinctions per million species per year is roughly 10× the background rate of 1 per million species per year; the shaded band shows the wider range of published estimates (tens to hundreds ×).
Figure 3. An illustrative index of mean population size (baseline 100 in 1970) modelled as exponential decline to 31 by 2020
− a fall of 69%, about 2.3% per year − the kind of steep downward trend that population indices reveal and that is cited as evidence for a biodiversity crisis.
4. Causes of biodiversity loss
The drivers of biodiversity loss are overwhelmingly anthropogenic (human-caused). A useful way to remember the main threats is the acronym HIPPO: Habitat loss, Invasive species, Pollution, Population (human) growth, and Overexploitation — with climate change now cutting across all of them. Each reduces population sizes, and small populations are far more likely to go extinct.
Cause How it reduces populations
Habitat destruction and fragmentation
Clearing forest, draining wetland and building infrastructure removes the space, food and shelter species need. Fragmentation splits a population into small, isolated groups with reduced gene flow, making local extinction and inbreeding more likely.
Overexploitation Hunting, fishing and harvesting faster than populations can reproduce drives numbers down; commercial demand (e.g. for ivory, timber or fish) can collapse a population before it recovers.
Invasive (alien) species Introduced species with no local predators may out-compete, prey on, or bring disease to native species that have not evolved defences, as on isolated islands.
Pollution Chemicals, plastics, excess nutrients (eutrophication) and light or noise pollution poison organisms, degrade habitats and disrupt breeding, reducing survival and reproduction.
Climate change Shifting temperature and rainfall move the ranges species can tolerate; those unable to migrate or adapt fast enough decline. It also drives coral bleaching, ocean acidification and mismatches between species and their food or pollinators.
How the threats combine
These causes rarely act alone. Fragmented habitat leaves populations small and vulnerable to the added stress of climate change or an invasive predator; pollution can weaken a population already reduced by overexploitation. This synergy is why biodiversity loss can accelerate once several pressures overlap.
Answer structure: For "explain how X reduces biodiversity," always finish the causal chain: the driver reduces survival or reproduction → population size falls → small isolated populations lose genetic diversity and are more likely to go extinct. Do not stop at "it harms them."
5. Consequences of biodiversity loss
Biodiversity is not valued only for its own sake; it underpins the natural systems human societies depend
- Losing it has practical, measurable consequences.
Ecosystem services
Ecosystem services are the benefits people obtain from ecosystems. They are commonly grouped as follows.
Category Examples
Provisioning Food, fresh water, timber, fibre, medicines and genetic resources.
Regulating Pollination of crops, climate and carbon regulation, water purification, flood control and pest control.
Supporting Soil formation, nutrient cycling and primary production that make the other services possible.
Cultural Recreation, tourism, education, and aesthetic, spiritual and scientific value.
Resilience and stability
More diverse ecosystems tend to be more resilient — better able to withstand and recover from disturbance such as disease, drought or storms. Where several species perform a similar role (functional redundancy), the loss of one can be compensated by others; in a species-poor system there is no such backup, so the whole system is more fragile.
Food security
Genetic diversity in crops and livestock, and their wild relatives, is the raw material for breeding varieties that resist new pests, diseases and climate stress. Reliance on a few genetically uniform varieties (monocultures) raises the risk that a single disease could devastate a food supply — so conserving genetic diversity is directly tied to long-term food security. Pollinators, on which a large share of crops depend, are a further critical link.
Link it back: A strong 6-mark answer connects a specific loss to a specific consequence: e.g. "decline of wild bee species reduces crop pollination (a regulating service), lowering yields and threatening food security."
6. Conservation methods: in-situ and ex-situ
Conservation strategies fall into two broad types. In-situ ("in place") conservation protects species within their natural habitat; ex-situ ("out of place") conservation maintains organisms outside their habitat. The two are complementary rather than alternatives.
In-situ methods
- Protected areas — national parks, nature reserves and marine protected areas that limit or exclude damaging activity.
- Habitat restoration — actively repairing degraded habitat, e.g. replanting native trees or re-flooding drained wetland.
- Rewilding — restoring natural processes and, where appropriate, reintroducing missing species (often keystone species) so an ecosystem becomes self-sustaining.
Ex-situ methods
- Zoos and aquaria and captive-breeding programmes that raise numbers for possible reintroduction.
- Botanic gardens maintaining living plant collections.
- Seed banks and gene (tissue/sperm) banks storing genetic material at low temperature for the long term.
Advantages Limitations
In-situ Conserves species in their natural habitat with normal behaviour, evolution and interactions; protects whole communities and ecosystem services at once; usually cheaper per species over time.
Difficult to protect from poaching, invasive species and climate change; needs large areas and enforcement; may conflict with human land use; slow to reverse if a population is already tiny.
Ex-situ Provides a safeguard when the wild population is critically low; allows captive breeding, research and reintroduction; seed/gene banks store huge genetic diversity cheaply in little space.
Expensive and limited in capacity; small captive populations risk inbreeding and loss of genetic diversity; animals may fail to adapt to the wild; does not conserve the habitat or ecosystem itself.
Best practice: The most effective programmes combine both: ex-situ breeding or seed banking buys time and rebuilds numbers, while in-situ protection and restoration ensures there is still a viable habitat to return the species to.
7. Prioritising species: the EDGE approach
Conservation resources are limited, so decisions must be made about where to focus them. One influential framework is the EDGE of Existence approach, which prioritises species that are both Evolutionarily Distinct and Globally Endangered.
Criterion Meaning Why it matters
Evolutionarily distinct A species with few close living relatives, representing a long, unique branch on the tree of life.
If it is lost, a large and irreplaceable amount of evolutionary history and unique genetic information disappears with it.
Globally endangered A species at high risk of extinction (high IUCN threat category).
The more endangered, the more urgent the need to act before it is too late.
Species scoring highly on both — such as certain unusual mammals, amphibians and reptiles with no near relatives — are ranked as priorities. The logic is that conserving an evolutionarily distinct species preserves more unique biodiversity than conserving one that has many similar relatives already surviving elsewhere.
Concept check: EDGE weights biodiversity by uniqueness, not just by species count. A species on a lonely branch of the evolutionary tree carries more distinct genetic and evolutionary information than one member of a large, closely related group.
8. Cooperation, legislation and indigenous knowledge
Because biodiversity and its threats cross national borders, effective conservation depends on cooperation at every level, from local communities to international agreements.
Approach Role in conservation
International agreements Treaties coordinate action between countries — for example agreements that regulate trade in endangered species, or global conventions committing nations to protect biological diversity and set area-based targets.
National legislation Laws create and enforce protected areas, ban or license hunting and harvesting, and control pollution and land use within a country.
NGOs and funding Conservation organisations run projects, raise funds, monitor species and lobby governments; scientific bodies assess status (e.g. Red List).
Indigenous and local knowledge
Indigenous peoples often manage highly biodiverse lands sustainably. Their long-established, place-based knowledge of species and ecosystems, and their involvement as partners, greatly improves conservation outcomes.
Rewilding as a case concept
Rewilding illustrates how these ideas combine. Reintroducing a missing keystone species — for instance a large predator or a grazing/engineering species — can restore natural processes (grazing patterns, river dynamics, seed dispersal) so that the ecosystem regulates itself with less human intervention. Success depends on suitable protected habitat (in-situ), sometimes captive breeding (ex-situ), supportive legislation, and the cooperation of local communities whose livelihoods the changes may affect. Careful monitoring is essential, because reintroductions can have unintended effects.
Exam framing: If asked to evaluate rewilding, give both sides: it can restore ecosystem function and resilience cheaply in the long run, but it can conflict with farming or safety concerns and its outcomes are uncertain, so it needs monitoring and community consent.
9. Using indices and indicators to evaluate conservation (HL)
(HL) Evaluating whether conservation is working requires quantitative evidence, not just species lists. Biologists use biodiversity indices, indicator species and monitoring data to judge the state of an ecosystem and the effect of management.
Biodiversity indices
A diversity index combines richness (how many species) and evenness (how balanced their abundances are) into a single figure, so that two communities with the same number of species can still be compared. A higher index value indicates greater diversity. Comparing an index before and after an intervention, or between a protected and an unprotected site, provides evidence of whether biodiversity is being maintained.
Why an index beats a count: Two ponds may each contain 5 species, but if one is dominated by a single species while the other has all five in similar numbers, the second is more diverse. A count of 5 hides this; a diversity index that includes evenness reveals it.
Figure 1. Two ponds of equal richness (5 species) and equal total abundance (N = 100) but different evenness. Simpson's index D = 1 − ∑(n/N)2 rewards evenness, so the even Pond A (D = 0.80) scores higher than the dominated Pond B (D =
0.60); the reciprocal form D = N(N − 1)/∑n(n − 1) gives 5.21 versus 2.54.
Indicator and keystone species
(HL) An indicator species is sensitive to particular conditions, so its presence, absence or abundance signals the health of an ecosystem — for example, lichens sensitive to air pollution, or aquatic invertebrates sensitive to water quality. Monitoring indicator species is a cheap, rapid way to detect change.
A keystone species has an effect on its community far larger than its abundance would suggest; removing it causes disproportionate, cascading change (often a collapse in diversity). Identifying and protecting keystone species is an efficient conservation strategy because doing so safeguards many dependent species at once.
Data-interpretation skill: When a graph shows diversity rising after a protected area is established, describe the trend precisely with figures, then consider confounding variables (weather, sampling method, time) before concluding the protection → the recovery. Correlation is not proof of causation.
10. Worked examples and applications
Worked example 1 — interpreting extinction-rate data
A student is told the background extinction rate is about 1 species per million species per year, and that a study estimates the current rate for a group of 20 000 assessed species at 20 extinctions per century. (a) Express the current rate per million species per year. (b) Comment on what this suggests.
- 20 extinctions per 20 000 species per 100 years = 20 / (20 000 × 100) = 1.0 × 10⁻⁵ per species per year. Scaled up: 1.0 × 10−5 × 106 = 10 per million species per year.
- This is roughly 10 × the background rate of 1 per million per year, consistent with a strongly elevated, human-driven extinction rate — evidence used to support the idea of a sixth mass extinction. Note the estimate depends on the assumed background rate and on how completely the group has been assessed.
Worked example 2 — choosing a conservation strategy
A critically endangered amphibian survives only in two small ponds threatened by a spreading fungal disease and by drainage for farming. Evaluate whether in-situ or ex-situ conservation is more appropriate.
In-situ alone is risky here: the wild population is tiny and both the disease and habitat drainage act directly on the remaining ponds, so the species could be lost before protection takes effect.
Ex-situ captive breeding provides an immediate safeguard: individuals can be bred in disease-free conditions and genetic diversity preserved, buying time.
Best answer: combine both — establish a captive-breeding insurance population (ex-situ) while protecting and restoring the ponds and managing the disease (in-situ), then reintroduce bred individuals once the habitat is secure. Justify by naming the specific threats each method addresses.
Worked example 3 — identifying causes from a case
On a remote island, a ground-nesting bird found nowhere else declined sharply after rats arrived on ships and after much native forest was cleared for plantations. Identify the causes of loss and explain the mechanisms.
Invasive species: introduced rats are predators the endemic bird did not evolve defences against; they eat eggs and chicks, lowering reproductive success.
Habitat destruction: clearing native forest removes nesting sites and food, reducing the area able to support the bird and fragmenting the population.
Because the species is endemic to one island, it has nowhere else to go, so these combined pressures make extinction especially likely — a classic island-biodiversity pattern.
Common pitfalls
- Treating biodiversity as "just the number of species." It also includes genetic and ecosystem diversity, and evenness as well as richness.
- Confusing described species (already named) with the far larger estimated total.
- Quoting extinction-rate multipliers as exact fact; they are estimates with wide uncertainty — state order of magnitude.
- Assuming a correlation in data proves causation; always consider confounding variables before concluding.
- Presenting in-situ and ex-situ as opposites; the best strategies usually integrate them.
- Forgetting to finish the causal chain from driver → smaller population → lost genetic diversity → higher extinction risk.
Quick reference
Term / idea Key point
Biodiversity Variety of life at three levels: species, genetic and ecosystem diversity.
Richness vs evenness Richness = number of species; evenness = how balanced their abundances are.
Hotspot Region rich in species and endemics but under threat; a conservation priority.
Background rate Natural long-term extinction rate, ≈ 1 per million species per year.
Sixth mass extinction Claim that current human-driven rates rival past mass-extinction events.
HIPPO Habitat loss, Invasive species, Pollution, Population growth, Overexploitation (+ climate change).
Ecosystem services Provisioning, regulating, supporting and cultural benefits from ecosystems.
In-situ Conservation within the natural habitat (parks, reserves, restoration, rewilding).
Ex-situ Conservation outside the habitat (zoos, botanic gardens, seed/gene banks, captive breeding).
EDGE Prioritises Evolutionarily Distinct and Globally Endangered species.
Diversity index (HL) Single figure combining richness and evenness for comparison.
Keystone species (HL) Species with a disproportionately large effect on its community.
Test yourself
Attempt these without notes; full answers follow.
- Define biodiversity and name its three components. [3]
- Explain the difference between the described number of species and the estimated total, and give two reasons the estimate is uncertain. [4]
- Outline what is meant by the background extinction rate and explain why the current period is called a possible sixth mass extinction. [4]
- For each of habitat fragmentation, an invasive predator and climate change, explain how it reduces a population. [6]
- Distinguish between in-situ and ex-situ conservation, giving one advantage and one limitation of each. [6]
- Explain the reasoning behind the EDGE approach to prioritising species. [3]
- (HL) Two woodlands each contain 6 tree species. Explain how a biodiversity index could still rank them differently. [3]
- A graph shows bird diversity rising after a reserve was created. Explain why this alone does not prove the reserve caused the increase. [3]
Answers
- Biodiversity is the variety of life in a defined area. Three components: species diversity (variety and evenness of species), genetic diversity (variety of alleles within a species), and ecosystem/habitat diversity (variety of habitats and communities). [3]
- Described species are those formally named and classified (roughly 1.8–2.1 million); the estimated total (commonly 8–10+ million eukaryotes) is much larger because most species are not yet discovered. Reasons for uncertainty (any two): under-sampling of the tropics and of small/hidden groups such as insects, fungi and microbes; difficulty defining species boundaries and cryptic species; reliance on extrapolation models with different assumptions. [4]
- The background rate is the natural long-term extinction rate from the fossil record, about 1 species per million species per year. Current estimated rates are many times higher (tens to hundreds ×), comparable in scale to the five past mass extinctions, so the present is called a possible sixth mass extinction — uniquely, one driven mainly by humans. [4]
- Habitat fragmentation splits a population into small isolated groups with reduced gene flow, lowering genetic diversity and raising local-extinction and inbreeding risk. An invasive predator preys on native species that lack evolved defences, reducing survival and reproductive success. Climate change shifts tolerable ranges faster than species can migrate or adapt, so populations unable to keep up decline. Each → smaller population → higher extinction risk. [6]
- In-situ conserves species in their natural habitat (e.g. national parks); ex-situ conserves them outside it (e.g. seed banks, captive breeding). In-situ: advantage – maintains natural behaviour, evolution and whole ecosystems; limitation – hard to protect from poaching, invasives and climate change. Ex-situ: advantage – safeguards critically low populations and allows breeding/reintroduction; limitation – expensive, small populations risk inbreeding, and it does not conserve the habitat. [6]
- EDGE prioritises species that are Evolutionarily Distinct (few close relatives, a unique branch of the tree of life) and Globally Endangered (high extinction risk). Losing a distinct species loses a large, irreplaceable amount of unique evolutionary and genetic information, so protecting it preserves more biodiversity per species saved. [3]
- (HL) A diversity index combines richness and evenness. With equal richness (6 species), the woodland where individuals are spread evenly across the species scores higher than one dominated by a single species with the others rare, because the index also rewards evenness. [3]
- The graph shows correlation, not causation. Other (confounding) factors could explain the rise – favourable weather, natural recovery, changed sampling effort or method, or a time trend unrelated to the reserve. A controlled comparison with an unprotected site and consistent methods would be needed before concluding the reserve caused the increase. [3]
