
IB Diploma · Biology · SL / HL · Theme C: Interaction and Interdependence
C4.2 Transfers of Energy and Matter
Opens inside this page. Prefer your own PDF app? Open the PDF.
Full text of C4.2 Transfers of Energy and Matter
IB DP BIOLOGY Theme C: Interaction and Interdependence C4.2 Transfers of Energy and Matter
Revision Notes · Standard and Higher Level Fahad H. Ahmad
+92 323 509 4443 | Megalecture.com
Original notes prepared for the IB Diploma Programme Biology course (2025 syllabus)
What the syllabus requires
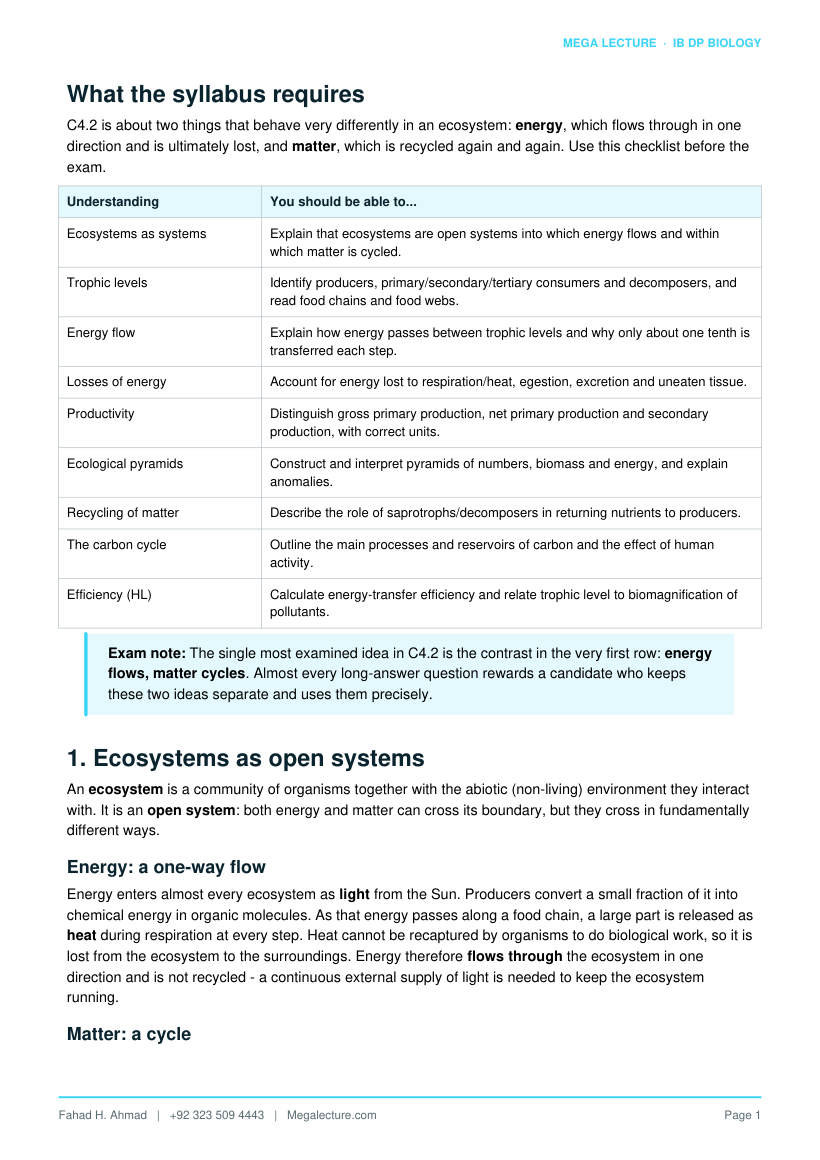
C4.2 is about two things that behave very differently in an ecosystem: energy, which flows through in one direction and is ultimately lost, and matter, which is recycled again and again. Use this checklist before the exam.
Understanding You should be able to...
Ecosystems as systems Explain that ecosystems are open systems into which energy flows and within which matter is cycled.
Trophic levels Identify producers, primary/secondary/tertiary consumers and decomposers, and read food chains and food webs.
Energy flow Explain how energy passes between trophic levels and why only about one tenth is transferred each step.
Losses of energy Account for energy lost to respiration/heat, egestion, excretion and uneaten tissue.
Productivity Distinguish gross primary production, net primary production and secondary production, with correct units.
Ecological pyramids Construct and interpret pyramids of numbers, biomass and energy, and explain anomalies.
Recycling of matter Describe the role of saprotrophs/decomposers in returning nutrients to producers.
The carbon cycle Outline the main processes and reservoirs of carbon and the effect of human activity.
Efficiency (HL) Calculate energy-transfer efficiency and relate trophic level to biomagnification of pollutants.
Exam note: The single most examined idea in C4.2 is the contrast in the very first row: energy flows, matter cycles. Almost every long-answer question rewards a candidate who keeps these two ideas separate and uses them precisely.
1. Ecosystems as open systems
An ecosystem is a community of organisms together with the abiotic (non-living) environment they interact with. It is an open system: both energy and matter can cross its boundary, but they cross in fundamentally different ways.
Energy: a one-way flow
Energy enters almost every ecosystem as light from the Sun. Producers convert a small fraction of it into chemical energy in organic molecules. As that energy passes along a food chain, a large part is released as heat during respiration at every step. Heat cannot be recaptured by organisms to do biological work, so it is lost from the ecosystem to the surroundings. Energy therefore flows through the ecosystem in one direction and is not recycled - a continuous external supply of light is needed to keep the ecosystem running.
Matter: a cycle
Matter is the atoms that make up living things - carbon, nitrogen, phosphorus, oxygen, hydrogen and so on. Unlike energy, these atoms are not destroyed or lost as heat. They are passed from producers to consumers by feeding, and returned to the abiotic environment by respiration, excretion and especially decomposition. The same atoms are then taken up again by producers. Matter is therefore recycled and, in principle, an ecosystem needs no external supply of new atoms.
Feature Energy Matter (nutrients)
Enters ecosystem as Light (mostly sunlight) Already present; cycled internally
Direction One way: flows through Repeatedly cycled
Fate at each step Much lost as heat via respiration Passed on or returned to environment
Can be reused by organisms? No (heat cannot do biological work) Yes (atoms are taken up again)
Needs continual external supply?
Yes No
Key distinction: Say it precisely: energy flows through and is lost as heat; matter is conserved and cycled. Never write that energy is recycled or that matter flows away.
2. Trophic levels, food chains and food webs
A trophic level is the position an organism occupies in a feeding sequence - essentially how many feeding steps separate it from the original source of energy.
Trophic level
Name How it obtains energy / matter Example
Producer (autotroph)
Makes organic molecules from inorganic ones, using light (photosynthesis)
Grass, algae, phytoplankton
Primary consumer Herbivore: eats producers Grasshopper, zooplankton
Secondary consumer
Carnivore: eats primary consumers Frog, small fish
Tertiary consumer Carnivore: eats secondary consumers Snake, large fish
- Decomposer Feeds on dead organic matter and wastes at every level
Bacteria, fungi
Food chains and food webs
A food chain shows a single sequence of feeding relationships, for example: grass → grasshopper → frog → snake. Each arrow points in the direction of energy (and matter) flow - that is, from the organism being eaten to the organism doing the eating. A common exam error is drawing arrows the wrong way; the arrow always points towards the consumer.
A food web is a set of interconnected food chains showing the many feeding relationships in a community. It is more realistic than a single chain because most organisms eat, and are eaten by, several species. An organism can occupy different trophic levels in different chains (for example, an omnivore that eats both plants and animals).
Arrow rule: In every food chain and food web the arrow means is eaten by and points in the direction of energy flow. Producer → consumer, never the reverse.
Figure. A food web. Each arrow means is eaten by and points in the direction of energy (and matter) flow: producers → primary → secondary → tertiary consumers. Dashed arrows return dead matter to the decomposers, which feed at every level.
Decomposers, detritivores and saprotrophs
Decomposers are not shown as a numbered trophic level, but they are essential because they feed at every level. Two overlapping groups are recognised. Saprotrophs (mostly bacteria and fungi) secrete enzymes onto dead matter and absorb the digested products - external digestion. Detritivores (such as earthworms and woodlice) ingest small particles of dead matter (detritus) and digest them internally. Both return nutrients to the environment, and both are considered later under the recycling of matter.
3. Energy flow and the ten per cent rule
Sunlight reaching producers is captured in photosynthesis and stored as chemical energy in organic molecules. Producers pass some of this energy to primary consumers when they are eaten, primary consumers pass some on to secondary consumers, and so on. However, the amount of energy available decreases sharply at each step. On average only about 10% of the energy in one trophic level is passed on to the next.
Why so much energy is lost
- Respiration and heat. Organisms respire to release energy for movement, growth and other processes. Much of this energy leaves the body as heat, which cannot be passed on to a consumer.
- Not all is eaten. Consumers do not eat every organism in the level below, and do not eat all parts of the organisms they do catch (bones, roots, bark).
- Not all is digested. Some ingested material is not absorbed and is lost as faeces (egestion).
- Excretion. Energy-containing nitrogenous wastes (such as urea) are lost from the body.
- Movement and other activity. Energy used to move, hunt and maintain body temperature is ultimately released as heat.
The energy that remains - stored in new body tissue and available to the next level - is therefore only a small fraction of what entered the level.
Consequences of the ten per cent rule
- Food chains are short, usually only four or five trophic levels, because after several steps too little energy remains to support another level.
- Top predators are rare and need large ranges, because very little of the original energy reaches them.
- Biomass generally decreases up a food chain, since less energy is available to build tissue at each higher level.
Careful: The figure of about 10% is an average, not a law. Real efficiencies range from roughly 2% to 20% depending on the organisms. Write “on average about 10%”, never “exactly 10%”.
Worked example (10% rule) - how many levels can be supported
Producers in a lake fix 100 000 kJ m−2 y−1 as net primary production. Assuming about 10% is transferred at each step, estimate the energy reaching a fourth-level carnivore, and comment on why a fifth level is unlikely.
Level 2 ≈ 10 000; level 3 ≈ 1 000; level 4 ≈ 100 kJ m−2 y−1.
A fifth level would receive only about 10 kJ m−2 y−1 - too little to support a viable population of predators, which is why food chains rarely exceed four or five links.
4. Productivity: GPP, NPP and secondary production
Productivity (or production) is the rate at which organisms convert energy into new biomass. Because it is a rate, it is always expressed per unit area per unit time, for example kJ m−2 y−1 (energy) or g m−2 y−1
(mass).
Term Meaning Relationship
Gross primary production (GPP)
Total energy fixed by producers in photosynthesis in a given area and time
The starting amount
Net primary production (NPP)
Energy stored as new producer biomass, i.e. what is left after producers respire
NPP = GPP − R
Respiration (R) Energy released by producers during respiration and lost mostly as heat
Subtracted from GPP
Secondary production Energy (or biomass) added by consumers as new body tissue in a given area and time
Built from the food they assimilate
NPP is the energy actually available to consumers (and to humans harvesting crops), because it is the energy stored in new plant material rather than burned off in the producer's own respiration. GPP cannot be measured directly; it is found by measuring NPP and adding an estimate of respiration.
Secondary production is the equivalent quantity for consumers: the new tissue (growth and reproduction) they add. It equals the energy they assimilate from food minus the energy they lose in respiration.
Worked example 1 - net primary production
In a grassland, producers fix energy at a gross rate of 24 000 kJ m−2 y−1 and lose 15 000 kJ m−2 y−1 in respiration. Calculate the net primary production.
NPP = GPP − R = 24 000 − 15 000 = 9 000 kJ m−2 y−1.
This 9 000 kJ m−2 y−1 is the energy stored as new plant biomass and so is the amount available to primary consumers.
Units matter: A productivity answer without units per area per time is incomplete. Include, for example, kJ m−2 y−1 or g m−2 y−1.
The energy budget of a consumer
Tracking energy through a single consumer explains where the losses in the ten per cent rule come from. Of the energy in its food (ingestion), part is never absorbed and is lost as faeces (egestion); the rest is assimilated. Assimilated energy is then split between respiration (released mostly as heat, and as excretory wastes) and production - the new body tissue that is actually available to the next trophic level.
Stage What happens to the energy
Ingestion Total energy in the food eaten
Egestion (faeces) Food that is not absorbed; lost before it can be used
Assimilation Ingestion − egestion: energy absorbed into the body
Respiration and excretion Assimilated energy released as heat, movement and nitrogenous waste
Production Assimilation − respiration: new tissue passed to the next level
Only the final row - production - counts towards the energy that reaches the next trophic level, which is why the transfer is so inefficient.
Worked example 2 - secondary production
A population of caterpillars ingests 4 000 kJ m−2 y−1 of leaf material. Of this, 2 400 is egested as faeces and 1 200 is used in respiration. Calculate the secondary production.
Assimilation = ingestion − egestion = 4 000 − 2 400 = 1 600 kJ m−2 y−1.
Production = assimilation − respiration = 1 600 − 1 200 = 400 kJ m−2 y−1 of new caterpillar tissue.
Measuring productivity
Net primary production can be estimated by measuring the increase in the dry mass of biomass over a period of time, for example by harvesting, drying and weighing samples of vegetation at the start and end of an interval. To find gross primary production, an estimate of the energy lost in producer respiration is added to NPP. In aquatic systems, productivity is often measured from the change in dissolved oxygen: oxygen produced in the light gives a measure of gross photosynthesis, while oxygen consumed in the dark gives respiration. Dry mass is used rather than fresh mass because water content varies and contains no usable energy.
Skill: When estimating NPP from biomass, remember to use dry mass per unit area per unit time, and that GPP = NPP + producer respiration.
5. Ecological pyramids
An ecological pyramid is a diagram in which horizontal bars represent successive trophic levels, drawn to scale and stacked with producers at the base. The width of each bar shows the quantity at that level. Three kinds are used.
Pyramid of... Each bar shows Typical shape Notes
Numbers Number of organisms at each level
Usually narrows upward, but not always
Ignores size; can be inverted or irregular
Biomass Mass of living tissue per unit area at each level
Usually narrows upward A snapshot in time; can be inverted in some aquatic systems
Energy Energy per unit area per unit time (e.g. kJ m−2 y−1)
Always narrows upward Most reliable; obeys the ten per cent rule
Why energy pyramids are always upright
Because energy is lost at every transfer (respiration, heat, egestion), each level necessarily contains less energy than the one below. An energy pyramid can therefore never be inverted - it must narrow upward. This is why the pyramid of energy is regarded as the most accurate representation of a food chain.
Figure. Pyramid of energy. With about 10% transfer between levels the available energy falls 10000 → 1000 → 100 → 10 kJ m−2 y−1. Each level holds one tenth of the one below, so the pyramid can never be inverted.
Anomalies in number and biomass pyramids
- Inverted pyramid of numbers. One large producer (for example a single oak tree) can support many primary consumers (thousands of insects), so a count of individuals gives a bar that is narrower at the base than above it.
- Inverted pyramid of biomass. In open water the producers are tiny, fast-reproducing phytoplankton with a small standing biomass at any one moment, yet they are eaten and replaced so quickly that they support a larger biomass of zooplankton. A single snapshot then shows more consumer biomass than producer biomass.
- Because these pyramids measure a standing stock at one instant, they can mislead. A pyramid of energy, which measures a rate over time, removes the anomaly.
Worked example 3 - constructing a pyramid
A meadow food chain has the following energy values in kJ m−2 y−1: producers 20 000, primary consumers 2 000, secondary consumers 180. Describe the pyramid of energy.
Draw three horizontal bars, centred and stacked, with producers (20 000) widest at the base, primary consumers (2 000) about one tenth as wide above them, and secondary consumers (180) narrower still at the top.
Each bar is roughly one tenth the width of the bar below, so the diagram narrows steadily upward - consistent with the ten per cent rule.
A numerical look at an inverted biomass pyramid
Suppose that at one instant a patch of open ocean holds 4 g m−2 of phytoplankton (producers) but supports 21 g m−2 of zooplankton (primary consumers). A pyramid of biomass drawn from these figures is inverted - the base is narrower than the level above it. This does not break the ten per cent rule: the phytoplankton reproduce and are eaten so rapidly that, although their standing biomass at any moment is small, the total biomass they produce over a year is far larger than that of the zooplankton. A pyramid of energy (a rate over time) for the same community would be upright.
Why it happens: Inverted biomass pyramids arise when producers have a high turnover - a short life and rapid reproduction - so a small standing stock still delivers a large flow of energy and matter to consumers.
6. Recycling of matter and the role of decomposers
While energy is lost, the atoms in dead organisms and wastes are not - they are returned to the environment and reused. This recycling depends on decomposers.
Saprotrophs and decomposition
Saprotrophs are organisms - chiefly bacteria and fungi - that feed on dead organic matter and wastes. They secrete digestive enzymes onto the material, break it down externally, and absorb the soluble products (external digestion). In doing so they release inorganic nutrients - for example carbon dioxide, mineral ions and ammonium - back into the soil, water and air, where producers can absorb them again.
Without decomposers, nutrients would stay locked up in dead bodies and wastes, producers would run short of raw materials, and nutrient cycles would stop. Decomposers therefore close every nutrient cycle and keep ecosystems supplied with the matter needed to build new biomass.
The general pattern of a nutrient cycle
- Producers take up inorganic nutrients from the abiotic environment and build them into organic molecules.
- Consumers obtain these nutrients by feeding, passing them along the food web.
- Death, egestion and excretion return organic matter to the environment.
- Decomposers break this matter down, releasing inorganic nutrients that producers can absorb once more - completing the cycle.
Contrast: A nutrient cycle is a closed loop for matter. Energy, by contrast, cannot loop - it is lost as heat at every step and must be resupplied by sunlight.
7. The carbon cycle
The carbon cycle is the best-known nutrient cycle and a favourite exam context. It traces carbon atoms as they move between living organisms and reservoirs of carbon in the atmosphere, oceans, rocks and fossil fuels.
Process What it does to carbon Direction
Photosynthesis Removes CO2 from air/water and fixes it into organic molecules in producers
Environment → organisms
Respiration Releases CO2 as organisms break down organic molecules Organisms → environment
Process What it does to carbon Direction
Feeding Passes carbon compounds from one organism to another Along the food web
Decomposition Saprotrophs release CO2 as they break down dead matter Dead matter → environment
Combustion Burning wood or fossil fuels releases CO2 Fuels → atmosphere
Fossilisation Incomplete decomposition over millions of years forms coal, oil and gas
Organisms → long-term store
Reservoirs and sinks
A carbon reservoir is a store of carbon; a carbon sink is a reservoir that absorbs more carbon than it releases. Major reservoirs include the atmosphere (as CO2), the oceans (dissolved CO2 and hydrogencarbonate ions), living and dead biomass, soils, sedimentary rock (limestone) and fossil fuels. Forests and oceans act as important sinks, taking up CO2 through photosynthesis and dissolving.
Figure. The carbon cycle. Carbon atoms are conserved and cycled endlessly between reservoirs by photosynthesis, respiration, feeding, decomposition and combustion - unlike energy, of which only about 10% passes to the next trophic level.
Human impact (link to D4.3)
For most of Earth's history the carbon cycle was roughly balanced. Human activity has disturbed it: combustion of fossil fuels transfers carbon that was locked away for millions of years back into the atmosphere as CO2, and deforestation removes producers that would otherwise absorb CO2. The result is a rising atmospheric CO2 concentration, which enhances the greenhouse effect and drives climate change (explored further in D4.3).
Worked example 4 - reading a carbon-cycle diagram
On a carbon-cycle diagram an arrow points from a fish to the label “CO2 in water”. Name the process and explain the direction.
The process is respiration. The fish breaks down organic molecules and releases CO2 into the surrounding water, so the arrow runs from the organism to the CO2 store.
An arrow in the opposite direction, from “CO2 in water” to an alga, would represent photosynthesis.
8. (HL) Efficiency, biomagnification and comparing ecosystems
(HL) Higher-level candidates must quantify energy transfer and use it to reason about pollutants and about the productivity of different ecosystems.
(HL) Energy-transfer efficiency
The energy-transfer efficiency between two trophic levels is the percentage of the energy in one level that becomes available in the next:
efficiency (%) = (production at level n+1 / production at level n) × 100
Here “production” means the energy stored as new biomass at each level (per unit area per unit time). Typical values cluster around 10%, which is where the ten per cent rule comes from, but they vary with the organisms involved.
Worked example 5 (HL) - efficiency between levels
Producers store 20 000 kJ m−2 y−1 as NPP. Primary consumers add 1 600 kJ m−2 y−1 of new tissue; secondary consumers add 128 kJ m−2 y−1. Find the efficiency of each transfer.
Producers → primary consumers: (1 600 / 20 000) × 100 = 8.0%.
Primary → secondary consumers: (128 / 1 600) × 100 = 8.0%.
Both transfers are about 8%, a little below the textbook 10% - a realistic result.
(HL) Biomagnification of pollutants
Some pollutants - for example certain pesticides (DDT), and heavy metals such as mercury - are fat-soluble or not excreted, so they are stored in an organism's tissues rather than broken down or lost. When a consumer eats many contaminated organisms, the pollutant it takes in is retained and accumulates. Because a predator eats a large mass of prey over its lifetime, and each prey item already carries a stored dose, the concentration of the pollutant increases at each higher trophic level. This is biomagnification.
The consequence is that top predators carry the highest concentrations and suffer the greatest harm, even when the pollutant is dilute in the water or soil. The same energy losses that make higher trophic levels rare therefore also concentrate persistent pollutants in exactly those organisms.
(HL) Comparing the productivity of ecosystems
Net primary production varies enormously between ecosystems, mainly with the availability of light, warmth, water and nutrients.
Ecosystem Relative NPP Main limiting factors
Tropical rainforest Very high Little limitation: warm, wet, bright year round
Estuary / coral reef Very high Rich nutrient supply and light
Temperate forest / grassland Moderate Seasonal light and temperature
Open ocean Low per unit area (huge in total)
Nutrient shortage in surface water
Desert / tundra Very low Water shortage (desert) or cold and short season (tundra)
(HL) Exam tip: When comparing ecosystems, quote NPP per unit area and name the limiting factor - light, temperature, water or nutrients - that explains the difference.
9. Skills, pitfalls and practice
Core calculations at a glance
Task Method
Net primary production NPP = GPP − R
Secondary production assimilated energy − respiration
Energy-transfer efficiency (HL) (energy in next level / energy in this level) × 100
Applying the ten per cent rule each level ≈ one tenth of the level below
Productivity units energy or mass per area per time, e.g. kJ m−2 y−1
Common pitfalls
- Writing that energy is recycled or that matter flows through. It is the other way round: energy flows and is lost as heat; matter cycles.
- Treating the 10% figure as exact. It is an average; real values vary (about 2-20%).
- Confusing GPP and NPP. NPP is what is left after producer respiration and is the energy available to consumers.
- Drawing food-chain arrows the wrong way. Arrows point from prey to predator, showing the direction of energy flow.
- Forgetting units of productivity (per area per time).
- Saying an energy pyramid can be inverted. It never can; only number and biomass pyramids can be.
- Calling all decomposers “consumers”. Saprotrophs feed by external digestion on dead matter and are shown separately.
Test yourself
Attempt all eight without notes, then check the worked answers below.
- Explain the difference between the way energy and the way matter move through an ecosystem.
- A pond food chain contains 500 kJ m−2 y−1 in primary consumers and 45 kJ m−2 y−1 in secondary consumers. Calculate the energy-transfer efficiency between these two levels. (HL)
- Producers in a woodland fix energy at a gross rate of 36 000 kJ m−2 y−1 and respire 20 000 kJ m−2 y−1. Calculate the net primary production and state its significance.
- Producers store 15 000 kJ m−2 y−1 as NPP. Using the ten per cent rule, estimate the energy available to tertiary consumers (level 4).
- Explain why a pyramid of numbers for an oak woodland can be inverted, but a pyramid of energy cannot.
- Describe how decomposers make the recycling of nutrients possible.
- Name three processes that transfer carbon in the carbon cycle and state the direction of each.
- Explain why persistent fat-soluble pollutants reach their highest concentration in top predators. (HL)
Answers
- Energy enters as sunlight, is fixed by producers, and is passed along the food chain, but a large part is lost as heat (mainly through respiration) at every step; it cannot be reused, so it flows through the ecosystem in one direction. Matter (atoms) is not lost as heat - it is passed on by feeding and returned to the environment by respiration, excretion and decomposition, then taken up again by producers, so it is cycled. In short: energy flows, matter cycles.
- Efficiency = (45 / 500) × 100 = 9.0%, close to the average of about 10%.
- NPP = GPP − R = 36 000 − 20 000 = 16 000 kJ m−2 y−1. This is the energy stored as new plant biomass and so the energy available to primary consumers.
- Applying ≈10% per step: level 2 = 1 500, level 3 = 150, level 4 = 15 kJ m−2 y−1 (15 000 × 0.1 × 0.1 × 0.1).
- A pyramid of numbers counts individuals regardless of size, so one very large producer (an oak tree) can support many small primary consumers, giving a narrow base and wider level above - an inverted shape. A pyramid of energy measures the energy at each level, and because energy is always lost at each transfer, every higher level must contain less energy than the one below; it therefore always narrows upward and can never invert.
- Decomposers (saprotrophic bacteria and fungi) feed on dead organisms and wastes, secreting enzymes that break organic matter down externally and absorbing the products. This releases inorganic nutrients (such as CO2, mineral ions and ammonium) back into the soil, water and air, where producers can absorb them again - closing the nutrient cycle.
- Any three, for example: photosynthesis - CO2 from the environment into producers; respiration - carbon from organisms released as CO2 to the environment; combustion - carbon in fuels released as CO2 to the atmosphere. (Decomposition and feeding are also acceptable.)
- The pollutant is fat-soluble or not excreted, so it is stored in body tissues rather than broken down or lost. Each organism takes in the pollutant already stored in all the prey it eats over its lifetime, so the concentration builds up at each higher trophic level (biomagnification). Top predators, at the end of the chain, accumulate the most and are harmed most, even when the pollutant is dilute in the environment.
Key terms glossary
Term Definition
Open system A system across whose boundary both energy and matter can pass
Trophic level The position of an organism in a food chain, defined by its feeding steps from the producers
Producer (autotroph) An organism that makes its own organic molecules from inorganic ones, usually using light
Consumer (heterotroph) An organism that obtains organic molecules by feeding on other organisms
Decomposer An organism that feeds on dead organic matter and wastes, recycling nutrients
Saprotroph A decomposer that digests dead matter externally and absorbs the products
Gross primary production Total energy fixed by producers in photosynthesis per unit area per unit time
Net primary production GPP minus producer respiration; the energy stored as new producer biomass
Secondary production New biomass added by consumers per unit area per unit time
Carbon sink A reservoir that absorbs more carbon than it releases
Biomagnification (HL) The increase in concentration of a persistent pollutant at each higher trophic level
Final reminder: If you remember one sentence from C4.2, make it this: energy flows through an ecosystem and is lost as heat, while matter is cycled; only about a tenth of the energy passes between trophic levels.
