
IB Diploma · Biology · SL / HL · Theme C: Interaction and Interdependence
C1.3 Photosynthesis
Opens inside this page. Prefer your own PDF app? Open the PDF.
Full text of C1.3 Photosynthesis
IB DP BIOLOGY Theme C: Interaction and Interdependence C1.3 Photosynthesis
Revision Notes · Standard and Higher Level Fahad H. Ahmad
+92 323 509 4443 | Megalecture.com
Original notes prepared for the IB Diploma Programme Biology course (first assessment 2025)
What the syllabus requires
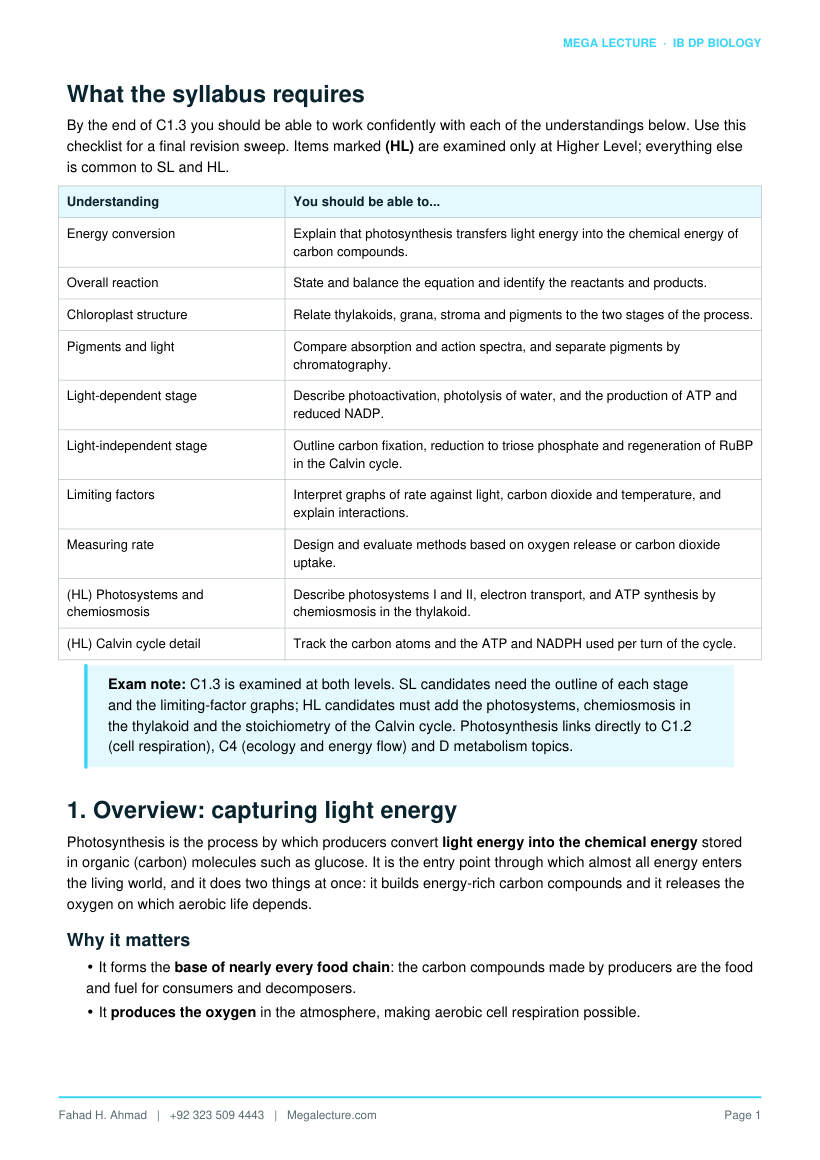
By the end of C1.3 you should be able to work confidently with each of the understandings below. Use this checklist for a final revision sweep. Items marked (HL) are examined only at Higher Level; everything else is common to SL and HL.
Understanding You should be able to...
Energy conversion Explain that photosynthesis transfers light energy into the chemical energy of carbon compounds.
Overall reaction State and balance the equation and identify the reactants and products.
Chloroplast structure Relate thylakoids, grana, stroma and pigments to the two stages of the process.
Pigments and light Compare absorption and action spectra, and separate pigments by chromatography.
Light-dependent stage Describe photoactivation, photolysis of water, and the production of ATP and reduced NADP.
Light-independent stage Outline carbon fixation, reduction to triose phosphate and regeneration of RuBP in the Calvin cycle.
Limiting factors Interpret graphs of rate against light, carbon dioxide and temperature, and explain interactions.
Measuring rate Design and evaluate methods based on oxygen release or carbon dioxide uptake.
(HL) Photosystems and chemiosmosis
Describe photosystems I and II, electron transport, and ATP synthesis by chemiosmosis in the thylakoid.
(HL) Calvin cycle detail Track the carbon atoms and the ATP and NADPH used per turn of the cycle.
Exam note: C1.3 is examined at both levels. SL candidates need the outline of each stage and the limiting-factor graphs; HL candidates must add the photosystems, chemiosmosis in the thylakoid and the stoichiometry of the Calvin cycle. Photosynthesis links directly to C1.2 (cell respiration), C4 (ecology and energy flow) and D metabolism topics.
1. Overview: capturing light energy
Photosynthesis is the process by which producers convert light energy into the chemical energy stored in organic (carbon) molecules such as glucose. It is the entry point through which almost all energy enters the living world, and it does two things at once: it builds energy-rich carbon compounds and it releases the oxygen on which aerobic life depends.
Why it matters
- It forms the base of nearly every food chain: the carbon compounds made by producers are the food and fuel for consumers and decomposers.
- It produces the oxygen in the atmosphere, making aerobic cell respiration possible.
- It removes carbon dioxide from the air and locks carbon into biomass, which is central to the carbon cycle and climate.
- It supplies the raw carbon skeletons used to build every other class of biological molecule: carbohydrates, lipids, proteins and nucleic acids.
The overall equation
The whole process can be summarised by one balanced equation. Read it as: six molecules of carbon dioxide plus six of water, using light energy, give one molecule of glucose and six of oxygen.
6 CO2 + 6 H2O → C6H12O6 + 6 O2
This is a redox reaction: carbon dioxide is reduced (it gains hydrogen and electrons) to form glucose, while water is oxidised (it loses electrons) to form oxygen. It is also strongly endothermic overall, because the light energy absorbed is stored in the bonds of glucose. Photosynthesis is essentially the reverse of aerobic respiration.
Key idea: Energy is not created here, only transferred and stored. Light energy becomes chemical potential energy held in carbon compounds, which is later released by respiration. Marking schemes reward the phrase “light energy to chemical energy in carbon compounds.”
2. The chloroplast: structure and function
Photosynthesis takes place inside the chloroplast, a double-membrane organelle found mainly in the mesophyll cells of leaves. Its internal architecture separates the two stages of the process and places the pigments and enzymes exactly where they are needed.
Structure Description Function in photosynthesis
Outer and inner membranes
Two membranes forming the envelope
Enclose the organelle and control what enters and leaves
Thylakoids Flattened membrane sacs Hold the pigments and electron carriers; site of the light-dependent reactions
Grana (singular granum)
Stacks of thylakoids Pack a very large membrane area into a small volume, so many pigment molecules face the light
Stroma Fluid surrounding the thylakoids Contains the enzymes (including RuBisCO); site of the light-independent reactions (Calvin cycle)
Chlorophyll and pigments
Molecules embedded in thylakoid membranes
Absorb light and pass its energy into the light-dependent reactions
Starch grains and lipid droplets
Storage inclusions in the stroma Store the products of photosynthesis
Circular DNA and ribosomes (70S)
In the stroma Allow the chloroplast to make some of its own proteins (evidence for endosymbiosis)
Structure related to function
- The thylakoid membranes give a huge surface area, so large numbers of pigment molecules and electron carriers can be arranged for efficient light capture and electron transport.
- Stacking thylakoids into grana maximises light absorption per unit volume of chloroplast.
- The thylakoid space is a sealed compartment, allowing a proton gradient to build up across the membrane to drive ATP synthesis (HL).
- The stroma is a fluid matrix that holds the Calvin-cycle enzymes in solution close to the ATP and NADPH made next door in the thylakoids.
Link: The two membranes and the internal thylakoid space are exactly the features that let a chloroplast run chemiosmosis, just as the mitochondrion does in respiration (C1.2). Compartmentalisation is the recurring theme.
3. Pigments, light and colour
Visible light is a mixture of wavelengths, seen as the colours of the spectrum from violet (short λ, about 400
- to red (long λ, about 700 nm). Photosynthetic pigments absorb some of these wavelengths and reflect others.
The pigments
Pigment Colour Role
Chlorophyll a Blue-green The main pigment; directly involved in the light reactions at the reaction centre
Chlorophyll b Yellow-green An accessory pigment that widens the range of light absorbed and passes energy to chlorophyll a
Carotenoids (carotene, xanthophyll)
Orange / yellow Accessory pigments; absorb wavelengths the chlorophylls miss and protect against light damage
Why plants look green
The chlorophylls absorb strongly in the blue-violet and red regions but absorb green light poorly. Green wavelengths are therefore mostly reflected or transmitted, so that is the colour that reaches our eyes. A leaf is green precisely because green is the light it uses least.
Absorption spectrum vs action spectrum
Absorption spectrum Action spectrum
What it shows How much light a pigment absorbs at each wavelength
How fast photosynthesis proceeds at each wavelength
How it is measured
With a spectrometer, on an extract of pigment By measuring rate (for example oxygen release) under each colour of light
Typical shape Peaks in blue-violet and red, a trough in green Peaks in blue-violet and red, low in green
The two graphs have a similar shape, and this close match is strong evidence that the pigments which absorb the light are the ones that drive photosynthesis. The action spectrum is slightly broader because accessory pigments also contribute wavelengths that the chlorophylls alone would miss.
Figure 1. Absorption spectra of chlorophyll a and b (peaks near 430 nm blue-violet and 662 nm red, with a trough in the green) closely match the action spectrum of photosynthesis − strong evidence that these pigments drive the process. Green light is largely reflected, so leaves look green.
Separating pigments by chromatography
A leaf extract can be separated into its pigments by paper or thin-layer chromatography. A spot of extract is placed near the bottom of the paper, which stands in a shallow solvent. As the solvent rises, each pigment travels a distance that depends on how soluble it is in the solvent and how strongly it clings to the paper. The pigments separate into coloured bands.
Each pigment is identified by its Rf value:
Rf = distance moved by the pigment → distance moved by the solvent front
Rf is always between 0 and 1, and is a constant for a given pigment and solvent, so it can be used to identify pigments. Carotenoids are the most soluble and travel furthest (highest Rf); the chlorophylls move less far.
Common error: The Rf value is the pigment distance divided by the solvent-front distance, both measured from the origin (the pencil line where the spot started), not from the bottom of the paper or the surface of the solvent.
4. The light-dependent reactions
The first stage happens in the thylakoid membranes and, as the name says, it can only run when light is available. Its job is to use light energy to make the two products the second stage needs: ATP and reduced NADP (NADPH), while releasing oxygen as a by-product.
Step 1 Photoactivation of chlorophyll
Light is absorbed by chlorophyll in the thylakoid membrane. The energy raises electrons in the chlorophyll to a higher energy level (they become photoactivated or “excited”). These high-energy electrons are passed to a chain of electron carriers in the membrane.
Step 2 Photolysis of water
The chlorophyll that has lost electrons must have them replaced. They come from the splitting of water using light energy, a reaction called photolysis:
2 H2O → 4 H+ + 4 e− + O2
Photolysis is the source of three things:
- Electrons that replace those lost by chlorophyll.
- Hydrogen ions (H+ protons) used to reduce NADP and, at HL, to build the proton gradient.
- Oxygen, which is released as the waste product of photosynthesis.
Step 3 Producing ATP (photophosphorylation)
As the photoactivated electrons pass down the chain of carriers, they release energy. This energy is used to make ATP from ADP and inorganic phosphate. Because the energy came originally from light, the process is called photophosphorylation.
Step 4 Producing reduced NADP
At the end of the chain the electrons, together with H+ ions from photolysis, are used to reduce NADP to NADPH (reduced NADP). NADPH is a carrier that shuttles both the electrons and the hydrogen to the stroma, where they will reduce carbon dioxide in the next stage.
NADP + 2 H+ + 2 e− → NADPH + H+
Summary of stage 1: In goes light, water, ADP + Pi and NADP; out come ATP, NADPH and oxygen. The ATP and NADPH move on to the Calvin cycle; the oxygen diffuses out of the leaf.
5. The light-independent reactions (Calvin cycle)
The second stage takes place in the stroma and does not use light directly. Instead it uses the ATP and NADPH made by the light-dependent stage to build carbon compounds from carbon dioxide. Because the reactions form a cycle first described by Melvin Calvin, they are called the Calvin cycle.
Step 1 Carbon fixation
Carbon dioxide from the air diffuses into the stroma and is joined to a five-carbon (5C) acceptor molecule, ribulose bisphosphate (RuBP). This reaction is catalysed by the enzyme RuBisCO (ribulose bisphosphate carboxylase). The unstable 6C product immediately splits into two molecules of the 3C compound glycerate 3-phosphate (GP). Because the first stable product has three carbons, this is called C3 photosynthesis.
Step 2 Reduction to triose phosphate
Each GP molecule is reduced to triose phosphate (TP, a 3C sugar). This step needs both products of the light reactions: ATP provides the energy and NADPH provides the hydrogen (reducing power).
Step 3 Products and regeneration of RuBP
Triose phosphate is the key branch point of the cycle:
- A small fraction leaves the cycle and is used to build glucose (two TP combine) and, from there, other carbohydrates, amino acids and lipids.
- Most of the TP is used, with more ATP, to regenerate RuBP so the cycle can continue to fix more carbon dioxide.
6 CO2 + 6 RuBP → 12 GP → 12 TP → 1 glucose + regenerated RuBP
Key idea: The Calvin cycle is often called “light-independent,” but it stops within seconds in the dark because it depends completely on the ATP and NADPH that only the light-dependent stage can supply.
6. Linking the two stages
The two stages are tightly coupled: the products of one are the raw materials of the other, so neither can run for long alone.
Light-dependent (thylakoid) Light-independent (stroma)
Needs Light, water, ADP + Pi, NADP CO2, RuBP, ATP, NADPH
Makes ATP, NADPH, O2 Triose phosphate → glucose; regenerated RuBP + ADP + NADP
Provides to the other stage
ATP and NADPH → Calvin cycle ADP + Pi and NADP → light reactions
The ATP and NADPH flow from the thylakoids to the stroma; the ADP, inorganic phosphate and NADP released when they are used flow back to the thylakoids to be recharged. This continuous recycling is why photosynthesis is self-sustaining as long as light, water and carbon dioxide are supplied.
Exam technique: If a question dims the light, remember the knock-on effect: less ATP and NADPH are made, so GP cannot be reduced. GP therefore rises and TP and RuBP fall. Reversing a supply always propagates through both stages.
Figure 2. The two stages of photosynthesis are coupled. The light-dependent reactions (thylakoid) pass ATP and NADPH to the Calvin cycle (stroma); the spent ADP + Pi and NADP return to be recharged. Six CO2 are fixed to build one glucose
(carbon balanced 6:6).
7. Limiting factors
A limiting factor is the factor in shortest supply that holds back the rate of photosynthesis at a given moment. Increasing it raises the rate; increasing any other factor has no effect until the limiting one is relieved (Blackman's law of limiting factors). The three main factors are light intensity, carbon dioxide concentration and temperature.
Light intensity
As light intensity rises from darkness, the rate increases in proportion, because more light means more photoactivation and more ATP and NADPH. Eventually the graph plateaus: light is no longer limiting and another factor (usually carbon dioxide or temperature) has taken over. The line begins slightly above the origin: at the compensation point photosynthesis exactly balances respiration.
Carbon dioxide concentration
With plenty of light, raising carbon dioxide concentration increases the rate, because RuBisCO can fix carbon faster. The curve again rises then plateaus once carbon dioxide is no longer limiting. Atmospheric carbon dioxide (about 0.04%) is often the natural limiting factor for crops.
Temperature
Temperature affects the enzyme-controlled reactions, mainly the Calvin cycle. The rate rises to an optimum as warming speeds enzyme and substrate movement, then falls sharply above the optimum as enzymes such as RuBisCO denature. The curve is therefore a peak, unlike the plateau shapes of light and carbon dioxide.
Factor Shape of graph (rate vs factor) Explanation of the plateau or fall
Light intensity Rises steeply, then plateaus At the plateau light is saturating; CO2 or temperature now limits
CO2 concentration Rises, then plateaus At the plateau CO2 is saturating; light or temperature now limits
Temperature Rises to an optimum, then falls Fall is due to denaturation of enzymes (for example RuBisCO)
Interaction of factors
At any moment only one factor is limiting. On a graph of rate against light intensity, a curve measured at higher carbon dioxide or higher temperature plateaus at a higher rate, because once light stops being limiting the extra carbon dioxide or warmth allows a faster maximum. Comparing such curves is a very common exam skill.
Application: greenhouses
Commercial growers raise yield by relieving limiting factors together: artificial lighting extends and intensifies the light, carbon dioxide enrichment (often from burners) lifts the carbon dioxide plateau, and heaters keep the temperature near the optimum. Pushing one factor alone is wasteful because another soon becomes limiting.
Common error: Do not describe the temperature graph as a plateau. Light and carbon dioxide curves plateau; the temperature curve peaks and then falls because high temperature denatures the enzymes.
Figure 3. Rate of photosynthesis against each limiting factor. Light intensity and CO2 concentration both rise then plateau once saturating; temperature rises to an optimum ( ≈ 28°C here) then falls as enzymes denature. The light curve crosses zero at the compensation point.
8. Measuring the rate of photosynthesis
Because the overall equation has clear reactants and products, the rate can be followed by measuring any of them. The three standard approaches are:
Method What is measured Notes and evaluation
Oxygen evolution Volume or rate of O2 gas released Direct product; can be collected over water or measured with an oxygen sensor
Carbon dioxide uptake Fall in CO2 (for example a rise in pH of an indicator, or a CO2 probe)
Measures the reactant used; respiration releases CO2 and must be accounted for
Aquatic plant bubble count
Number of gas bubbles per minute from a pondweed such as Elodea / Cabomba
Simple and quick; bubble size varies, so collecting and measuring gas volume is more reliable
The classic bubble experiment
A cut stem of aquatic pondweed is placed under an inverted funnel or in a capillary apparatus. As it photosynthesises, bubbles of oxygen are released and can be counted per minute, or the gas can be collected and its volume measured over a set time. Moving a lamp to measured distances changes the light intensity.
- Light intensity is proportional to 1 → d2 (the inverse-square law), where d is the distance from the lamp, so halving the distance roughly quadruples the intensity.
- A water bath or heat shield should sit between lamp and plant so that heat from the lamp does not change the temperature (a confounding variable).
- Control variables: temperature, carbon dioxide supply (often added as hydrogencarbonate), the same piece of plant, and time.
Because measured photosynthesis is really net photosynthesis, remember that the plant is also respiring; the true (gross) rate is the measured oxygen release plus the oxygen used in respiration.
Practical tip: Counting bubbles is quick but imprecise because bubbles differ in size. Collecting the gas in a capillary tube and measuring the length or volume of the column gives more reliable, quantitative data.
9. Deeper detail (HL)
Higher Level requires the mechanism behind the light-dependent stage and the book-keeping of the Calvin cycle. Items in this section are HL only.
Photosystems I and II (HL)
The pigments in the thylakoid membrane are organised into two clusters called photosystems, each with a reaction-centre chlorophyll a. They are numbered by the order of their discovery, not the order of use:
- Photosystem II (PSII) absorbs light best at 680 nm. Its excited electrons enter the electron transport chain; the electrons it loses are replaced by the photolysis of water, which is why PSII is where oxygen is produced.
- Photosystem I (PSI) absorbs light best at 700 nm. It re-energises the electrons arriving from PSII and passes them, with H+, to reduce NADP to NADPH.
Non-cyclic electron flow and chemiosmosis (HL)
In non-cyclic photophosphorylation electrons flow one way: water → PSII → electron carriers → PSI → NADP. As electrons move through the carriers between the photosystems, their energy is used to pump H+ ions from the stroma into the thylakoid space. Together with the H+ released by photolysis, this builds a high concentration of protons inside the thylakoid: a proton (electrochemical) gradient.
The protons then diffuse back into the stroma down their gradient through the enzyme ATP synthase. The flow of protons drives the enzyme to phosphorylate ADP, making ATP. This coupling of a proton gradient to ATP production is called chemiosmosis, exactly the same principle used by the mitochondrion.
- Cyclic photophosphorylation (HL): electrons from PSI can instead return to the electron chain, pumping more protons and making extra ATP without producing NADPH or oxygen. This tops up ATP when the Calvin cycle needs more ATP than NADPH.
Calvin-cycle stoichiometry (HL)
To make one molecule of glucose (a 6C sugar), the cycle must fix six molecules of carbon dioxide and therefore turn six times. Tracking the carbon:
Per glucose (6 turns) Amount Comment
CO2 fixed Each joined to a RuBP by RuBisCO
RuBP used and regenerated Regenerated so the cycle continues
GP (glycerate 3-phosphate) formed
First stable 3C product (C3)
TP (triose phosphate) formed 10 regenerate RuBP, 2 build glucose
ATP used 12 in reduction of GP, 6 in regenerating RuBP
Per glucose (6 turns) Amount Comment
NADPH used Reduces GP to TP
So each turn of the cycle fixes one carbon dioxide using 3 ATP and 2 NADPH; six turns build one glucose using 18 ATP and 12 NADPH. This greater demand for ATP than NADPH is part of why cyclic photophosphorylation exists.
Exam technique: For HL carbon-fixation questions, always start from the number of carbons. One glucose has six carbons, so six CO2 and six turns; then scale GP, TP, ATP and NADPH from there.
10. Worked examples and exam skills
Worked example 1 - interpreting a limiting-factor graph
A graph shows the rate of photosynthesis rising steeply with light intensity and then levelling to a horizontal plateau. Explain the two regions.
Steep region: light is the limiting factor. As intensity increases, more chlorophyll is photoactivated, so more ATP and NADPH are produced and the rate rises roughly in proportion.
Plateau: light is no longer limiting. Some other factor, most likely carbon dioxide concentration or temperature, now limits the rate, so extra light has no further effect.
A second curve measured at a higher carbon dioxide concentration would plateau at a higher rate, confirming carbon dioxide as the new limiting factor.
Worked example 2 - identifying stage and location
State where in the chloroplast, and in which stage, each of the following happens: (a) photolysis of water, (b) fixation of CO2 by RuBisCO, (c) reduction of NADP.
- Thylakoid membrane, light-dependent stage.
- Stroma, light-independent stage (Calvin cycle).
- Thylakoid membrane, light-dependent stage.
Worked example 3 - absorption vs action spectrum
Explain why the action spectrum of photosynthesis has a similar shape to the absorption spectrum of chlorophyll, and why the two are not identical.
The wavelengths absorbed by chlorophyll (blue-violet and red) are the ones whose energy drives photosynthesis, so the rate peaks where absorption peaks and both dip in the green. The close match is evidence that the absorbing pigments are the ones powering the process.
They are not identical because accessory pigments (chlorophyll b, carotenoids) absorb some extra wavelengths and pass that energy on, so the action spectrum is a little broader and higher between the main peaks.
Worked example 4 - calculating a rate from bubble data
A pondweed released 90 bubbles of oxygen in 3 minutes at one lamp distance, and 150 bubbles in 3 minutes when the lamp was moved closer. Calculate both rates in bubbles per minute and comment.
Rate 1 = 90 → 3 = 30 bubbles min−1.
Rate 2 = 150 → 3 = 50 bubbles min−1.
Moving the lamp closer raised the light intensity (inverse-square law), so photosynthesis sped up. Bubble counting is quick but imprecise; measuring the volume of gas collected would give more reliable data.
Worked example 5 - explaining photolysis
An experiment supplies a plant with water containing the heavy oxygen isotope, H2O with 18O. The oxygen gas released is found to be 18O2. Explain what this shows.
The oxygen released in photosynthesis comes from the splitting of water (photolysis), not from carbon dioxide. Labelling the oxygen in water and finding it in the oxygen gas proves water is the source.
Photolysis, 2 H2O → 4 H+ + 4 e− + O2, also supplies the electrons that replace those lost by chlorophyll and the H+ used to reduce NADP.
Worked example 6 - a shift in the Calvin cycle
A brightly illuminated plant is suddenly placed in darkness. Predict what happens to the amounts of GP, TP and RuBP, and explain.
In the dark no ATP or NADPH is made. Without them GP cannot be reduced to TP, so GP rises and TP falls.
RuBP falls, because it is still being used up by RuBisCO to fix carbon dioxide into GP, but there is no TP being converted back to regenerate it.
11. Common pitfalls
- Saying the oxygen comes from carbon dioxide. It comes from the photolysis of water.
- Calling the Calvin cycle “the dark reaction” and assuming it needs darkness. It is light-independent but still depends on the ATP and NADPH made in the light.
- Forgetting that RuBisCO fixes CO2 onto RuBP; the enzyme name and its reaction are frequently examined.
- Confusing the two stages' locations: light-dependent in the thylakoids, light-independent in the stroma.
- Describing the temperature graph as a plateau. It peaks and falls because enzymes denature above the optimum.
- Ignoring respiration when measuring rate: the plant also uses oxygen, so measured (net) photosynthesis is less than the true (gross) rate.
- Mixing up the photosystems (HL): PSII splits water and comes first in electron flow, even though it has the higher number.
12. Quick reference
Item Summary
Overall equation 6 CO2 + 6 H2O → C6H12O6 + 6 O2 (needs light)
Light-dependent stage In thylakoids: photoactivation, photolysis of water, makes ATP + NADPH + O2
Photolysis 2 H2O → 4 H+ + 4 e− + O2; source of O2, H+, electrons
Light-independent stage In stroma (Calvin cycle): CO2 + RuBP → GP → TP; uses ATP + NADPH
Key enzyme RuBisCO fixes CO2 onto RuBP (first product GP, so C3)
Limiting factors Light and CO2: rise then plateau. Temperature: rises to optimum then falls (denaturation)
Measuring rate O2 released, CO2 taken up, or bubbles from pondweed per minute
Photosystems (HL) PSII (680 nm) splits water; PSI (700 nm) reduces NADP; non-cyclic flow water → NADP
Chemiosmosis (HL) Proton gradient across thylakoid drives ATP synthase to make ATP
Stoichiometry (HL) Per glucose: 6 CO2, 6 turns, 18 ATP, 12 NADPH
13. Practice questions
Attempt each question fully before reading the worked answer that follows it.
Q1. State the overall balanced equation for photosynthesis and identify which reactant is oxidised and which is reduced. [3]
Q2. Explain how the structure of a chloroplast is adapted for the two stages of photosynthesis. [4]
Q3. Distinguish between an absorption spectrum and an action spectrum, and explain why plant leaves appear green. [4]
Q4. Describe the roles of light, water and NADP in the light-dependent reactions. [4]
Q5. Outline the three phases of the Calvin cycle, naming RuBP, GP and TP. [4]
Q6. A greenhouse grower adds a carbon dioxide burner on a bright warm day and yield increases. Explain, using the idea of limiting factors. [3]
Q7. Describe how you would measure the effect of light intensity on the rate of photosynthesis using an aquatic plant, including one control variable. [4]
Q8. (HL) Explain how a proton gradient is set up in the thylakoid and how it is used to make ATP. [4]
Worked answers
A1. 6 CO2 + 6 H2O → C6H12O6 + 6 O2, requiring light. Carbon dioxide is reduced (gains hydrogen/electrons to form glucose); water is oxidised (loses electrons to form oxygen).
A2. The thylakoid membranes give a large surface area, stacked into grana, to hold many pigment molecules for the light-dependent reactions; the sealed thylakoid space allows a proton gradient to form. The stroma holds the enzymes (RuBisCO) for the light-independent Calvin cycle, close to the ATP and NADPH made in the thylakoids.
A3. An absorption spectrum shows how much light a pigment absorbs at each wavelength; an action spectrum shows the rate of photosynthesis at each wavelength. Leaves appear green because chlorophyll absorbs blue-violet and red strongly but reflects/transmits green light.
A4. Light is absorbed by chlorophyll and photoactivates electrons. Water is split by photolysis, providing replacement electrons, H+ ions and oxygen. NADP accepts electrons and H+ to become NADPH, which carries reducing power to the Calvin cycle.
A5. (1) Fixation: RuBisCO joins CO2 to RuBP (5C), forming two GP (3C). (2) Reduction: GP is reduced to TP (3C) using ATP and NADPH. (3) Regeneration: most TP is used, with ATP, to regenerate RuBP; the rest forms glucose.
A6. On a bright warm day light and temperature are not limiting, so carbon dioxide is the limiting factor. Adding carbon dioxide relieves that limit, so RuBisCO fixes carbon faster and the rate of photosynthesis (and yield) rises until another factor becomes limiting.
A7. Place a piece of pondweed in hydrogencarbonate solution and count oxygen bubbles (or collect and measure the gas) per minute. Move a lamp to set distances to vary light intensity and record the rate at each. Control temperature (use a heat shield / water bath), carbon dioxide supply and the same plant. Plot rate against light intensity.
A8. (HL) As electrons pass along the carriers between PSII and PSI, their energy pumps H+ from the stroma into the thylakoid space; photolysis of water adds more H+ there. This builds a proton gradient. The H+ diffuse back into the stroma through ATP synthase, and this flow drives the enzyme to make ATP from ADP + Pi (chemiosmosis).
