
SAT · Practice tests · SAT Math: Problem-Solving and Data Analysis, study guide and worked solutions
SAT Math: Problem-Solving and Data Analysis, study guide and worked solutions
Need more than one subject? All-notes pass: unlimited downloads of every note for a year: unlimited downloads of every note on the site, PKR 999 a year. All packs and courses.
Opens inside this page. Prefer your own PDF app? Open the PDF.
Check yourself
5 quick questions on SAT
Tap an answer to see if you are right, and why. Free, no sign-up.
Start the free testWas this note useful?
Full text of SAT Math: Problem-Solving and Data Analysis, study guide and worked solutions
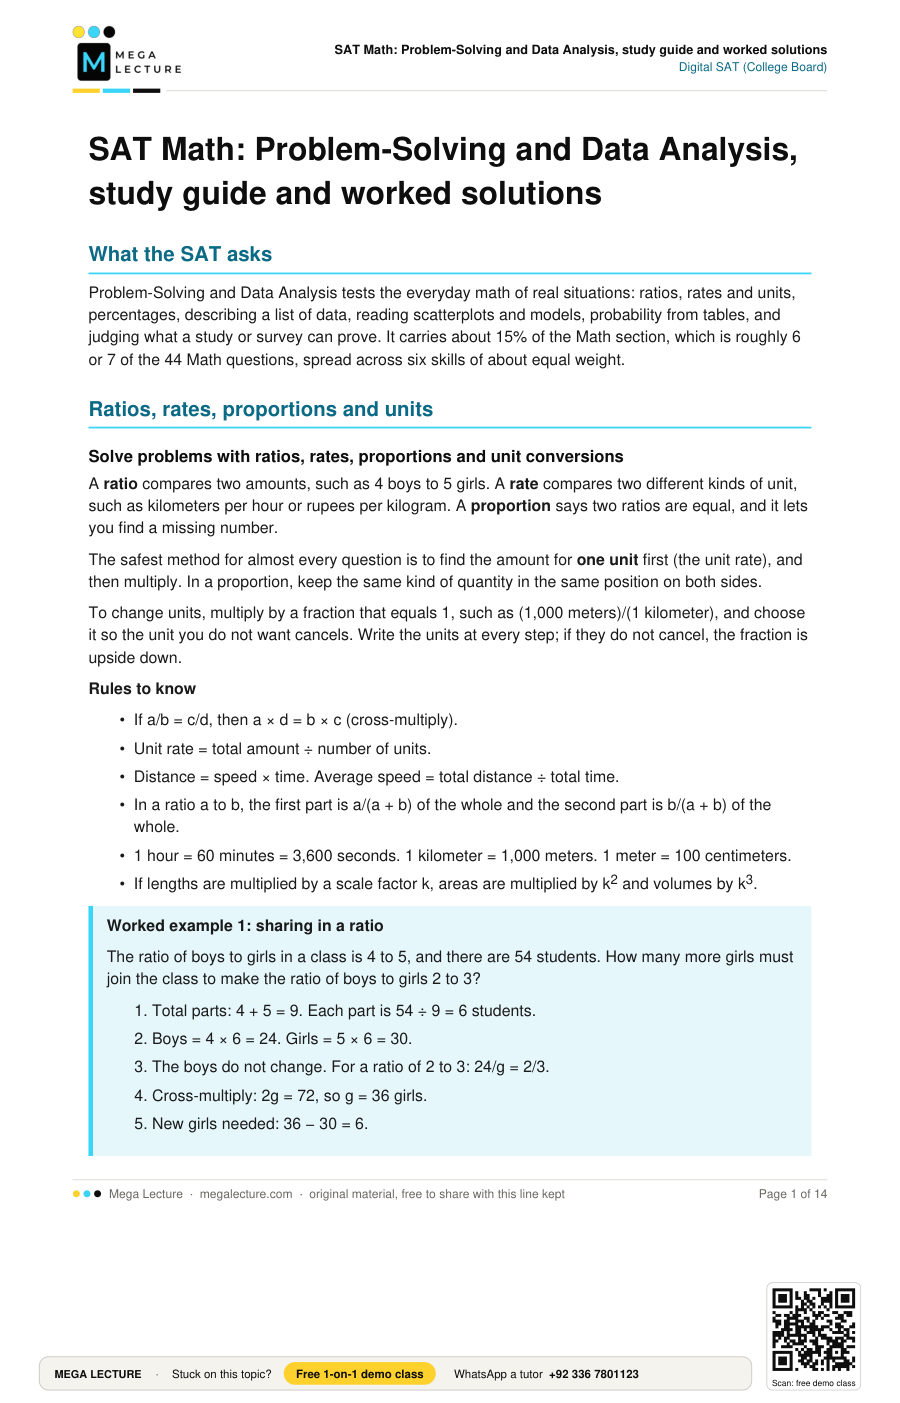
What the SAT asks
Problem-Solving and Data Analysis tests the everyday math of real situations: ratios, rates and units, percentages, describing a list of data, reading scatterplots and models, probability from tables, and judging what a study or survey can prove. It carries about 15% of the Math section, which is roughly 6 or 7 of the 44 Math questions, spread across six skills of about equal weight.
Ratios, rates, proportions and units
Solve problems with ratios, rates, proportions and unit conversions
A ratio compares two amounts, such as 4 boys to 5 girls. A rate compares two different kinds of unit, such as kilometers per hour or rupees per kilogram. A proportion says two ratios are equal, and it lets you find a missing number.
The safest method for almost every question is to find the amount for one unit first (the unit rate), and then multiply. In a proportion, keep the same kind of quantity in the same position on both sides.
To change units, multiply by a fraction that equals 1, such as (1,000 meters)/(1 kilometer), and choose it so the unit you do not want cancels. Write the units at every step; if they do not cancel, the fraction is upside down.
Rules to know
- If a/b = c/d, then a × d = b × c (cross-multiply).
- Unit rate = total amount ÷ number of units.
- Distance = speed × time. Average speed = total distance ÷ total time.
- In a ratio a to b, the first part is a/(a + b) of the whole and the second part is b/(a + b) of the whole.
- 1 hour = 60 minutes = 3,600 seconds. 1 kilometer = 1,000 meters. 1 meter = 100 centimeters.
- If lengths are multiplied by a scale factor k, areas are multiplied by k2 and volumes by k3.
Worked example 1: sharing in a ratio
The ratio of boys to girls in a class is 4 to 5, and there are 54 students. How many more girls must join the class to make the ratio of boys to girls 2 to 3?
- Total parts: 4 + 5 = 9. Each part is 54 ÷ 9 = 6 students.
- Boys = 4 × 6 = 24. Girls = 5 × 6 = 30.
- The boys do not change. For a ratio of 2 to 3: 24/g = 2/3.
- Cross-multiply: 2g = 72, so g = 36 girls.
- New girls needed: 36 − 30 = 6.
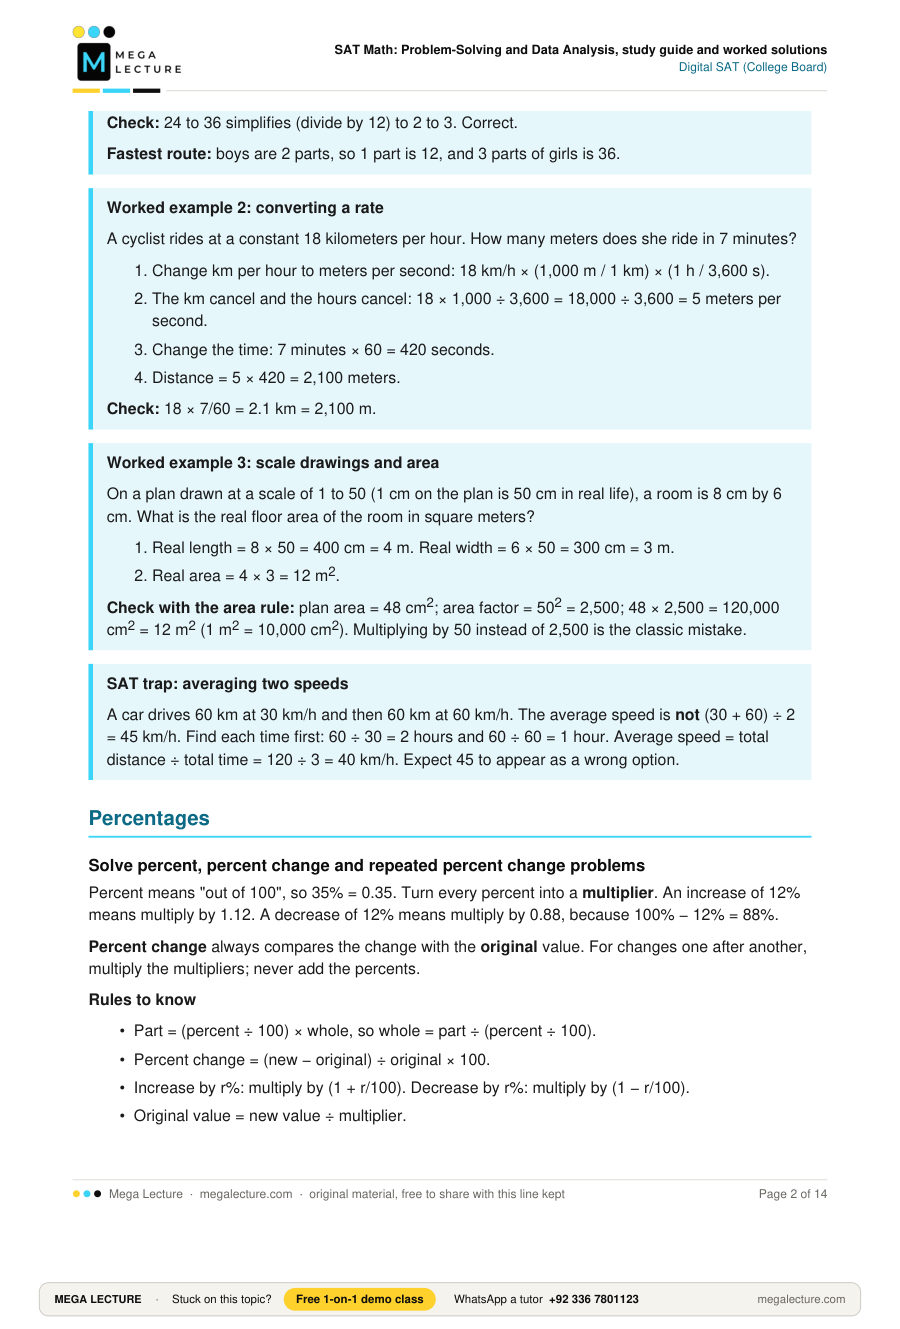
Check: 24 to 36 simplifies (divide by 12) to 2 to 3. Correct.
Fastest route: boys are 2 parts, so 1 part is 12, and 3 parts of girls is 36.
Worked example 2: converting a rate
A cyclist rides at a constant 18 kilometers per hour. How many meters does she ride in 7 minutes?
- Change km per hour to meters per second: 18 km/h × (1,000 m / 1 km) × (1 h / 3,600 s).
- The km cancel and the hours cancel: 18 × 1,000 ÷ 3,600 = 18,000 ÷ 3,600 = 5 meters per second.
- Change the time: 7 minutes × 60 = 420 seconds.
- Distance = 5 × 420 = 2,100 meters.
Check: 18 × 7/60 = 2.1 km = 2,100 m.
Worked example 3: scale drawings and area
On a plan drawn at a scale of 1 to 50 (1 cm on the plan is 50 cm in real life), a room is 8 cm by 6 cm. What is the real floor area of the room in square meters?
- Real length = 8 × 50 = 400 cm = 4 m. Real width = 6 × 50 = 300 cm = 3 m.
- Real area = 4 × 3 = 12 m2.
Check with the area rule: plan area = 48 cm2; area factor = 502 = 2,500; 48 × 2,500 = 120,000 cm2 = 12 m2 (1 m2 = 10,000 cm2). Multiplying by 50 instead of 2,500 is the classic mistake.
SAT trap: averaging two speeds
A car drives 60 km at 30 km/h and then 60 km at 60 km/h. The average speed is not (30 + 60) ÷ 2 = 45 km/h. Find each time first: 60 ÷ 30 = 2 hours and 60 ÷ 60 = 1 hour. Average speed = total distance ÷ total time = 120 ÷ 3 = 40 km/h. Expect 45 to appear as a wrong option.
Percentages
Solve percent, percent change and repeated percent change problems
Percent means "out of 100", so 35% = 0.35. Turn every percent into a multiplier. An increase of 12% means multiply by 1.12. A decrease of 12% means multiply by 0.88, because 100% − 12% = 88%.
Percent change always compares the change with the original value. For changes one after another, multiply the multipliers; never add the percents.
Rules to know
- Part = (percent ÷ 100) × whole, so whole = part ÷ (percent ÷ 100).
- Percent change = (new − original) ÷ original × 100.
- Increase by r%: multiply by (1 + r/100). Decrease by r%: multiply by (1 − r/100).
- Original value = new value ÷ multiplier.
- Changes in a row: multiply the multipliers. For example, +30% then −30% gives 1.30 × 0.70 = 0.91, a 9% decrease overall.
- Growth at r% for n periods: final = original × (1 + r/100)n.
- A rise from 20% to 25% is 5 percentage points, but it is a 25% increase, because 5 ÷ 20 = 0.25.
Worked example 1: percent change in both directions
The price of a book rises from $40 to $52. Later it falls back from $52 to $40. Find each percent change.
- Rise: change = 52 − 40 = 12. Percent change = 12 ÷ 40 × 100 = 30% increase.
- Fall: change = 40 − 52 = −12. Percent change = −12 ÷ 52 × 100 ≈ −23.1%, a decrease of about 23.1%.
The same $12 is a different percent because the starting value is different.
Worked example 2: going back to the original
A bill comes to $53 after a 6% tax is added. What was the price before tax?
- Adding 6% means the price was multiplied by 1.06.
- 1.06 × price = 53, so price = 53 ÷ 1.06 = 50.
Check: 6% of 50 is 3, and 50 + 3 = 53. Correct.
Worked example 3: repeated change
A deposit of $5,000 earns 4% interest per year, added to the account at the end of each year. How much is in the account after 3 years?
- Multiplier per year = 1.04.
- After 3 years: 5,000 × 1.043.
- 1.042 = 1.0816, and 1.0816 × 1.04 = 1.124864.
- 5,000 × 1.124864 = 5,624.32.
Answer: $5,624.32. Adding 12% to the original gives $5,600, which ignores interest on interest.
Desmos shortcut
Type the whole expression, 5000(1.04)^3, and Desmos shows 5624.32 at once. For an unknown rate, such as "what yearly rate turns 5,000 into 5,624.32 in 3 years", type 5000(1+x)^3 = 5624.32 and read the x-value of the vertical line on the positive side: x = 0.04, so 4%.
SAT trap: undoing a change with the same percent
If a price goes up 25% and then down 25%, it does not return to the start: 1.25 × 0.75 = 0.9375, a 6.25% loss overall. In the same way, after a 12% rise you cannot "take 12% off" to get back; you must divide by 1.12. Whenever a question gives you the amount after a change, divide by the multiplier.
One-variable data
Find and compare mean, median, range and standard deviation, including the effect of outliers
These questions give one list of numbers, often as a dot plot, frequency table or histogram. Two things matter: the center of the data (mean and median) and the spread of the data (range and standard deviation).
You never calculate a standard deviation by hand on the SAT; you only compare. Values packed close to the mean give a small one. An outlier is a value far from all the others. It pulls the mean toward itself and makes the range and standard deviation bigger, but it hardly moves the median.
Rules to know
- Mean = sum of the values ÷ number of values, so sum = mean × number of values.
- Median = the middle value once the values are in order. With an even number of values, it is the mean of the two middle values.
- Range = greatest value − least value.
- Add the same number c to every value: the mean and median go up by c; the range and standard deviation do not change.
- Multiply every value by a positive number k: the mean, median, range and standard deviation are all multiplied by k.
- Removing a large outlier makes the mean, range and standard deviation smaller; the median changes little.
Worked example 1: the effect of an outlier
The data are 4, 7, 7, 9, 10, 12, 50. Find the mean, median and range, then find them again with 50 removed.
- Sum = 4 + 7 + 7 + 9 + 10 + 12 + 50 = 99. Mean = 99 ÷ 7 ≈ 14.14.
- Seven values, so the median is the 4th: 9.
- Range = 50 − 4 = 46.
- Without 50: sum = 99 − 50 = 49, six values, mean = 49 ÷ 6 ≈ 8.17.
- Median of 4, 7, 7, 9, 10, 12 is the mean of the 3rd and 4th values: (7 + 9) ÷ 2 = 8.
- Range = 12 − 4 = 8.
Conclusion: removing the outlier lowered the mean by about 6, the median by only 1, and the range from 46 to 8.
Worked example 2: a frequency table
| Number of books read | Number of students |
|---|---|
| 1 | 3 |
| 2 | 5 |
| 3 | 8 |
| 4 | 4 |
Find the median and the mean number of books.
- Total students = 3 + 5 + 8 + 4 = 20. The median is the mean of the 10th and 11th values.
- Count positions: values 1 fill positions 1 to 3, values 2 fill positions 4 to 8, values 3 fill positions 9 to 16.
- The 10th and 11th values are both 3, so the median is 3.
- Sum = 1(3) + 2(5) + 3(8) + 4(4) = 3 + 10 + 24 + 16 = 53.
- Mean = 53 ÷ 20 = 2.65.
Worked example 3: comparing standard deviations
Set A is 48, 49, 50, 51, 52. Set B is 30, 40, 50, 60, 70. Both have mean 50 and median 50. Which has the greater standard deviation?
In Set A every value is within 2 of the mean; in Set B values are up to 20 away. So Set B has the greater standard deviation. No calculation is needed.
Desmos shortcut
Type L = [4, 7, 7, 9, 10, 12, 50] on one line, then mean(L), median(L) and stdev(L) on the next lines. Desmos gives each value at once.
SAT trap: the median of unordered data
If a list is given out of order, such as 15, 3, 22, 8, 10, the middle number written (22) is not the median. Put the list in order first: 3, 8, 10, 15, 22, so the median is 10. With a frequency table, count to the middle position; do not pick the middle row.
Two-variable data
Interpret a line of best fit and linear or exponential models of data
Each data point has two values, x and y, usually shown on a scatterplot. A line of best fit runs through the middle of the points and gives a predicted y for each x.
Some data follow a curve better than a line. If y changes by the same amount for each equal step in x, the model is linear. If y is multiplied by the same number for each equal step in x, the model is exponential. Test this with differences and ratios.
Rules to know
- Slope = the predicted change in y when x increases by 1 unit. Always say it with units.
- y-intercept = the predicted value of y when x = 0.
- A point above the line: the actual y is greater than predicted. A point below the line: the actual y is less than predicted.
- Linear model y = mx + b: equal differences in y for equal steps in x.
- Exponential model y = a(b)x: a is the value when x = 0, and y is multiplied by b for each increase of 1 in x.
- b = 1 + r for growth at rate r, and b = 1 − r for decay. For example, b = 0.94 means a 6% decrease per step.
Worked example 1: reading a line of best fit
For a group of plants, the line of best fit for height h, in centimeters, against time w, in weeks, is h = 1.8w + 12. One plant was 27 cm tall at week 10.
- Slope 1.8: each extra week, the predicted height increases by 1.8 cm.
- Intercept 12: the predicted height at week 0 is 12 cm.
- Prediction at week 10: h = 1.8(10) + 12 = 18 + 12 = 30 cm.
- Actual − predicted = 27 − 30 = −3. The plant is 3 cm shorter than predicted, so its point lies below the line.
Worked example 2: linear or exponential?
| x | 0 | 1 | 2 | 3 |
|---|---|---|---|---|
| Table P: y | 50 | 60 | 72 | 86.4 |
| Table Q: y | 80 | 77 | 74 | 71 |
- Table P differences: 10, 12, 14.4. Not equal, so not linear.
- Table P ratios: 60 ÷ 50 = 1.2, 72 ÷ 60 = 1.2, 86.4 ÷ 72 = 1.2. Equal, so exponential: y = 50(1.2)x, growth of 20% per step.
- Table Q differences: −3, −3, −3. Equal, so linear with slope −3 and intercept 80: y = 80 − 3x.
Check: 50(1.2)3 = 50 × 1.728 = 86.4. Correct.
Desmos shortcut: regression
Click + and add a table. Enter the x-values in the x1 column and the y-values in the y1 column. On a new line, type y1 ~ mx1 + b for a line, or y1 ~ abx1 for an exponential model (type it as y_1 ~ a b^(x_1)). Desmos prints the values of m and b, or a and b, and an R2 value; the closer R2 is to 1, the better the fit.
SAT trap: reading the base as the percent
In V = 900(0.85)t, the value does not fall by 85% each year. The base is the fraction that remains, so the value falls by 1 − 0.85 = 0.15 = 15% each year. Likewise, 1.07 means a 7% increase, not 107%.
Probability
Find probabilities and conditional probabilities, including from two-way tables
A probability is the number of outcomes you want over the number possible, always between 0 and 1.
If the question says "given that", or chooses from one group only (for example, "a person from Karachi is selected"), the bottom of the fraction is that group's total, not the whole table. This is a conditional probability. For two picks in a row, multiply; if the first item is not put back, both the top and the bottom go down by one before the second pick.
Rules to know
- Probability = number of favorable outcomes ÷ total number of possible outcomes.
- P(not A) = 1 − P(A).
- Independent events: P(A and B) = P(A) × P(B).
- P(A or B) = P(A) + P(B) − P(A and B).
- P(A given B) = P(A and B) ÷ P(B). In a table: the cell that is both, divided by the total for B.
- P(at least one) = 1 − P(none).
- Expected number = probability × number of trials or people.
Worked example 1: a two-way table
A survey asked 200 phone owners in two cities which type of phone they use.
| Android | iPhone | Total | |
|---|---|---|---|
| Lahore | 64 | 16 | 80 |
| Karachi | 90 | 30 | 120 |
| Total | 154 | 46 | 200 |
- P(a randomly chosen person uses an iPhone) = 46 ÷ 200 = 23/100.
- An iPhone user is chosen. P(the person is from Karachi) = 30 ÷ 46 = 15/23. The total is the iPhone column, 46.
- A Karachi person is chosen. P(the person uses an iPhone) = 30 ÷ 120 = 1/4. The total is the Karachi row, 120.
- P(Lahore or iPhone) = 80/200 + 46/200 − 16/200 = 110/200 = 11/20.
Check for step 4: 80 Lahore people + 30 Karachi iPhone users = 110.
Worked example 2: without replacement
A box has 12 bulbs, and 3 are faulty. Two bulbs are taken at random, one after the other, without putting the first back. What is the probability that both are faulty?
- First pick: 3 faulty out of 12, so 3/12.
- Second pick: 2 faulty left out of 11 bulbs, so 2/11.
- Both: 3/12 × 2/11 = 6/132 = 1/22.
Worked example 3: at least one, and expected number
A fair six-sided die is rolled twice. What is the probability of at least one 6?
- P(no 6 on one roll) = 5/6. P(no 6 on both) = 5/6 × 5/6 = 25/36.
- P(at least one 6) = 1 − 25/36 = 11/36.
Expected number: if P(a shopper uses a discount code) = 0.15, then of 600 shoppers about 0.15 × 600 = 90 will.
SAT trap: the wrong total
The most common mistake is dividing by the grand total when the question chooses from one row or column only. The words after "selected from" or "given that" name the group whose total goes on the bottom.
Samples, studies and margin of error
Draw conclusions from samples, margins of error, observational studies and experiments
These questions ask what you are allowed to conclude. Ask two questions about any study.
- How were the people chosen? If they were a random sample from a population, the results can be applied to that population, and to no wider group. Volunteers, or people from one convenient place, may not represent anyone else.
- How were they put into groups? If the researcher randomly assigned people to treatments, the study is an experiment and can show cause and effect. If people chose for themselves, the study shows only a link (an association).
A sample result is an estimate. The margin of error gives a range around it where the true population value plausibly lies.
Rules to know
- Plausible range = estimate − margin of error to estimate + margin of error.
- A larger random sample usually gives a smaller margin of error.
- The margin of error is about the population mean or percent, not about individuals.
- Estimated number in a population = sample proportion × population size.
Worked example 1: a margin of error
A random sample of 400 students at one university found a mean of 6.8 hours of sleep a night, with a margin of error of 0.3 hours. What can be concluded?
- Plausible range: 6.8 − 0.3 = 6.5 to 6.8 + 0.3 = 7.1 hours.
- The population is all students at this university.
- Conclusion: it is plausible that the mean sleep of all students at this university is between 6.5 and 7.1 hours.
Not allowed: "every student sleeps 6.5 to 7.1 hours", or any claim about other universities.
Worked example 2: an estimate for a population
In a random sample of 250 of the 12,000 workers at a company, 18% walk to work. The margin of error is 5%. Give a plausible range for the number of workers at the company who walk to work.
- Plausible percent: 18% − 5% = 13% to 18% + 5% = 23%.
- Lower: 0.13 × 12,000 = 1,560.
- Upper: 0.23 × 12,000 = 2,760.
Answer: between 1,560 and 2,760 workers. The best single estimate is 0.18 × 12,000 = 2,160.
Worked example 3: association or cause?
A researcher surveyed 1,000 randomly chosen adults in a city. Adults who said they walk every day reported lower stress than adults who do not.
- Random sample, so the result applies to adults in that city.
- People chose whether to walk, so this is an observational study.
- Allowed conclusion: among adults in this city, daily walking is associated with lower reported stress.
- Not allowed: "walking causes lower stress".
SAT trap: biased samples and over-reaching
A survey of people leaving a gym about how often adults exercise is biased, because gym users exercise more than most people. So is an online poll anyone can answer, since people with strong views reply more. When an option says "all people", "proves" or "causes", check whether the study had both a random sample (for "all") and random assignment (for "causes"). Most wrong options claim too much.
Practice set
Questions 1 to 11 are multiple choice. Questions 12 to 14 are student-produced responses: type your own answer. Aim for about 75 seconds each.
1. A printer prints 84 pages in 3 minutes at a constant rate. At this rate, how many pages does it print in 20 minutes?
A) 252
B) 560
C) 1,680
D) 280
2. A water tank leaks at a constant rate of 1.5 liters per hour. How many liters leak in 2 days and 6 hours?
A) 39
B) 45
C) 72
D) 81
3. After a 20% discount, a jacket costs $64. What was the price of the jacket before the discount?
A) $76.80
B) $51.20
C) $80.00
D) $84.00
4. The population of a town is 25,000 and increases by 8% each year. Which expression gives the population of the town after 5 years?
A) 25,000(1.08)5
B) 25,000(0.08)5
C) 25,000(1.40)
D) 25,000(1.8)5
5. The mean of 10 values in a data set is 30. It is then found that one value, 48, was recorded wrongly as 84. When the error is corrected, what is the mean of the 10 values?
A) 3.6
B) 30
C) 26.4
D) 33.6
6. A data set consists of the 8 values 12, 15, 15, 18, 20, 22, 25 and 60. The value 60 is removed. Which statement about the new data set of 7 values is true?
A) The mean decreases by more than the median decreases, and the range decreases.
B) The median does not change.
C) The mean and the median decrease by the same amount.
D) The standard deviation increases.
7. For a sample of used cars, the line of best fit for the price P, in thousands of dollars, against age a, in years, is P = −1.2a + 18.5. Which statement is the best interpretation of −1.2 in this context?
A) A car of age 0 is predicted to cost $1,200.
B) For each additional year of age, the predicted price decreases by 1.2%.
C) The predicted price of a car decreases by $18,500 each year.
D) For each additional year of age, the predicted price decreases by $1,200.
8. The table shows the value y, in dollars, of a piece of equipment t years after it was bought.
| t | 0 | 1 | 2 | 3 |
|---|---|---|---|---|
| y | 2,000 | 1,800 | 1,620 | 1,458 |
Which equation models the data?
A) y = 2,000 − 200t
B) y = 2,000(0.9)t
C) y = 2,000(0.1)t
D) y = 1,800(0.9)t
9. The table shows the clubs chosen by 150 students in Grades 11 and 12. Each student chose exactly one club.
| Science club | Debate club | Total | |
|---|---|---|---|
| Grade 11 | 24 | 50 | 74 |
| Grade 12 | 36 | 40 | 76 |
| Total | 60 | 90 | 150 |
A Grade 12 student is selected at random. What is the probability that the student chose the Science club?
A) 6/25
B) 3/5
C) 9/19
D) 38/75
10. A random sample of 600 adults was selected from the 450,000 adults in a city. Of those sampled, 42% said they support building a new park, with a margin of error of 3%. Which conclusion is most appropriate?
A) Between 39% and 45% of the 600 adults in the sample support building the park.
B) It is plausible that between 39% and 45% of all adults in the city support building the park.
C) Exactly 42% of all adults in the city support building the park.
D) It is plausible that between 39% and 45% of all adults in the country support building the park.
11. A researcher recruited 300 volunteers. Half were randomly assigned to solve a set of puzzles while listening to music, and the other half solved the same puzzles in silence. The silence group finished the puzzles in much less time, on average. Which conclusion is most appropriate?
A) For people similar to the volunteers, solving puzzles in silence rather than with music is likely to cause faster solving times.
B) For all adults in Pakistan, solving puzzles in silence causes faster solving times.
C) Silence is associated with faster solving times, but no cause-and-effect conclusion can be drawn.
D) Because the volunteers were not a random sample, no conclusion of any kind can be drawn.
12. A car travels 120 kilometers at a constant speed of 60 kilometers per hour and then travels another 120 kilometers at a constant speed of 40 kilometers per hour. What is the average speed, in kilometers per hour, for the whole trip?
13. A store increases the price of a lamp by 25%. Later, it decreases the new price by p%. The final price is 10% greater than the original price. What is the value of p?
14. A bag contains 4 red marbles and 6 green marbles. Two marbles are drawn at random, one after the other, without replacement. What is the probability that both marbles are green?
Solutions
1. Answer: B (560)
- Unit rate = 84 ÷ 3 = 28 pages per minute.
- In 20 minutes: 28 × 20 = 560 pages.
Check: 84/3 = x/20 gives 3x = 1,680, so x = 560. C forgets to divide by 3; A is 84 × 3; D uses 10 minutes.
Skill: Ratios, rates, proportions and units
2. Answer: D (81)
- Change the time to hours: 2 days = 2 × 24 = 48 hours, plus 6 hours = 54 hours.
- Liters leaked = 1.5 × 54 = 81.
C leaves out the 6 hours; A uses 26 hours; B treats a day as 12 hours.
Skill: Ratios, rates, proportions and units
3. Answer: C ($80.00)
- A 20% discount means the original price was multiplied by 0.80.
- 0.80 × original = 64, so original = 64 ÷ 0.80 = 80.
Check: 80 − 16 = 64. A adds 20% of $64; B takes 20% off $64 again; D adds $20, not 20%.
Skill: Percentages
4. Answer: A
- An 8% increase each year means the multiplier is 1 + 0.08 = 1.08.
- One multiplication per year for 5 years: 25,000(1.08)5.
B uses the rate, not the multiplier. C adds 8% of the original five times (40%), ignoring growth on growth. D is an 80% yearly increase.
Skill: Percentages
5. Answer: C (26.4)
- Wrong sum = 30 × 10 = 300.
- Correct sum = 300 − 84 + 48 = 264.
- Correct mean = 264 ÷ 10 = 26.4.
Fast route: the sum fell by 36, so the mean falls by 3.6. A is the change, not the new mean; D adds 3.6; B ignores the correction.
Skill: One-variable data
6. Answer: A
- Original sum = 12 + 15 + 15 + 18 + 20 + 22 + 25 + 60 = 187. Original mean = 187 ÷ 8 = 23.375.
- Original median: 8 values, so the mean of the 4th and 5th: (18 + 20) ÷ 2 = 19.
- Original range = 60 − 12 = 48.
- New sum = 187 − 60 = 127. New mean = 127 ÷ 7 ≈ 18.14. The mean falls by about 5.23.
- New median: 7 values, so the 4th value: 18. The median falls by 1.
- New range = 25 − 12 = 13, so the range decreases.
B is false (19 becomes 18), C is false (5.23 is not 1), and D is false: removing a value far from the mean makes the standard deviation smaller.
Skill: One-variable data
7. Answer: D
- The slope, −1.2, is the predicted change in P when a increases by 1.
- P is in thousands of dollars, so −1.2 means a decrease of 1.2 × 1,000 = $1,200 per additional year.
A confuses slope with intercept; B reads the slope as a percent, but a linear model changes by a fixed amount; C uses the intercept as the yearly change.
Skill: Two-variable data
8. Answer: B
- Differences: 1,800 − 2,000 = −200, 1,620 − 1,800 = −180. Not equal, so the model is not linear, and option A fails at t = 2 (it gives 1,600).
- Ratios: 1,800 ÷ 2,000 = 0.9, 1,620 ÷ 1,800 = 0.9, 1,458 ÷ 1,620 = 0.9. Equal, so the model is exponential with base 0.9.
- At t = 0 the value is 2,000, so y = 2,000(0.9)t.
Check: 2,000 × 0.729 = 1,458. C uses the rate of decrease (0.1) as the base; D starts at the t = 1 value.
Skill: Two-variable data
9. Answer: C (9/19)
- The student is selected from Grade 12 only, so the total is the Grade 12 row: 76.
- Grade 12 students in the Science club: 36.
- Probability = 36 ÷ 76 = 9/19 (divide top and bottom by 4).
A divides by the grand total. B divides by the Science club total, which answers a different question. D is P(Grade 12) from everyone.
Skill: Probability
10. Answer: B
- Plausible range: 42% − 3% = 39% to 42% + 3% = 45%.
- The sample was random from the adults of this city, so the range applies to all adults in the city.
A is wrong: in the sample the percent is exactly 42%; the margin of error is about the population. C treats an estimate as exact. D goes beyond the population sampled.
Skill: Samples, studies and margin of error
11. Answer: A
- The volunteers were randomly assigned to music or silence, so this is an experiment, and a cause-and-effect conclusion is allowed.
- The volunteers were not a random sample of any larger population, so the conclusion applies to people like the volunteers, not to everyone.
B generalizes to all adults in Pakistan, which needs a random sample. C ignores the random assignment. D goes too far: a conclusion about people like the volunteers is allowed.
Skill: Samples, studies and margin of error
12. Answer: 48
- Time for the first part: 120 ÷ 60 = 2 hours.
- Time for the second part: 120 ÷ 40 = 3 hours.
- Total distance = 120 + 120 = 240 km. Total time = 2 + 3 = 5 hours.
- Average speed = 240 ÷ 5 = 48 km/h.
The tempting answer, (60 + 40) ÷ 2 = 50, is wrong because the car spends more time at 40 km/h. Accepted answer: 48.
Skill: Ratios, rates, proportions and units
13. Answer: 12
- Let the original price be 1 (any value works). After a 25% increase: 1 × 1.25 = 1.25.
- After a decrease of p%: 1.25 × (1 − p/100).
- The final price is 10% more than the original: 1.25 × (1 − p/100) = 1.10.
- 1 − p/100 = 1.10 ÷ 1.25 = 0.88.
- p/100 = 0.12, so p = 12.
Check with $100: $100 rises to $125, and 12% of 125 is 15, so the price falls to $110, which is 10% more than $100. The tempting answer 15 (25 − 10) adds and subtracts percents directly. Desmos route: type 1.25(1 − x/100) = 1.1 and read x = 12. Accepted answer: 12.
Skill: Percentages
14. Answer: 1/3
- First draw: 6 green out of 10 marbles, so 6/10.
- Without replacement, 5 green remain out of 9 marbles, so 5/9.
- Both green: 6/10 × 5/9 = 30/90 = 1/3.
A student who forgets that the first marble is not replaced gets 6/10 × 6/10 = 9/25. Accepted answers: 1/3, .3333 or 0.333.
Skill: Probability
