
A Level · Economics 9708 · Basic economic ideas and the price system: AS notes
Basic economic ideas and the price system: AS notes
Opens inside this page. Prefer your own PDF app? Open the PDF.
Check yourself
5 quick questions on A Level Economics
Tap an answer to see if you are right, and why. Free, no sign-up.
Start the free test14 of 15 students found these notes useful
Was this note useful?
Full text of Basic economic ideas and the price system: AS notes
These revision notes cover the first two AS topics of Cambridge International AS & A Level Economics (9708): basic economic ideas and resource allocation, and the price system and the microeconomy. They explain the key concepts, give the definitions you should know precisely, and describe every diagram in words and tables. Worked examples show each step of the calculations. At the end you will find a key terms table and 13 quick-check questions with full answers.
1. Scarcity, choice and opportunity cost
The basic economic problem is that human wants are unlimited but the resources available to satisfy them are limited. Because of this scarcity, every individual, firm and government must make choices. Every society has to answer three questions:
- What to produce, and in what quantities?
- How to produce it (which combination of resources and which methods)?
- For whom to produce (how output is shared out among people)?
Opportunity cost is the value of the next best alternative given up when a choice is made.
Opportunity cost is the next best alternative only, not every alternative added together. Example: a student in Lahore has Rs 3,000. She can buy a textbook, go to a concert or buy trainers. If she buys the textbook and the concert was her second choice, the opportunity cost is the concert. The trainers do not count.
A good is scarce when the amount people would want if it were free is more than the amount available. Scarcity is not the same as shortage. A shortage is a market situation in which quantity demanded is greater than quantity supplied at the current price. It is usually temporary if price is free to rise, but it can persist, for example under a maximum price set below equilibrium.
2. Economic methodology
Economics is a social science. It studies human behaviour using the scientific method: it builds theories and tests them against evidence. It cannot run fully controlled experiments, because people and markets keep changing. Economists therefore rely on these tools:
- Ceteris paribus ("other things being equal"): look at the effect of changing one variable while all other variables are held constant. Every demand and supply curve is drawn on this assumption.
- Models: simplified versions of reality built on assumptions, for example that consumers aim to maximise their satisfaction.
- Time periods: in the short run at least one factor of production is fixed. In the long run all factors can be changed. In the very long run technology and the institutional framework can change too.
- Decisions at the margin: most choices are about a little more or a little less of something. A firm deciding whether to open for one extra hour compares the extra (marginal) revenue with the extra (marginal) cost.
A positive statement is a statement of fact that can be tested against evidence. It may be true or false.
A normative statement contains a value judgement about what ought to be. It cannot be proved true or false by evidence alone.
| Positive | Normative |
|---|---|
| "A rise in the price of sugar will reduce the quantity of sugar demanded." | "Sugar is too cheap and should be taxed more heavily." |
| "Youth unemployment in the country was higher last year than five years earlier." | "Reducing youth unemployment is the government's most important task." |
Tip: words such as should, ought, fair, too high or better usually signal a normative statement. A positive statement can still be false. What makes it positive is that it can be tested.
3. Factors of production
| Factor | Meaning | Example | Reward |
|---|---|---|---|
| Land | All natural resources | Farmland in Punjab, natural gas, fish stocks | Rent |
| Labour | Human effort, both physical and mental | Teachers, factory workers, software developers | Wages |
| Capital | Man-made goods used to produce other goods and services (not money itself) | Machinery, delivery vans, office buildings | Interest |
| Enterprise | Organising the other factors and bearing risk | The founder of a new textile business | Profit |
The entrepreneur spots opportunities, organises land, labour and capital, makes the key decisions and takes the risk of loss. Profit is the reward for that risk.
Specialisation means concentrating on a narrow range of tasks or products. Division of labour is specialisation by workers, where production is split into separate tasks. It raises output per worker because workers become skilled through repetition, lose less time moving between tasks, and can use specialist machinery. Its drawbacks are boredom and lower motivation, the risk that one hold-up stops the whole production line, and workers whose narrow skills make it harder to find other jobs.
4. Resource allocation in different economic systems
An economic system is the way a society answers the what, how and for whom questions.
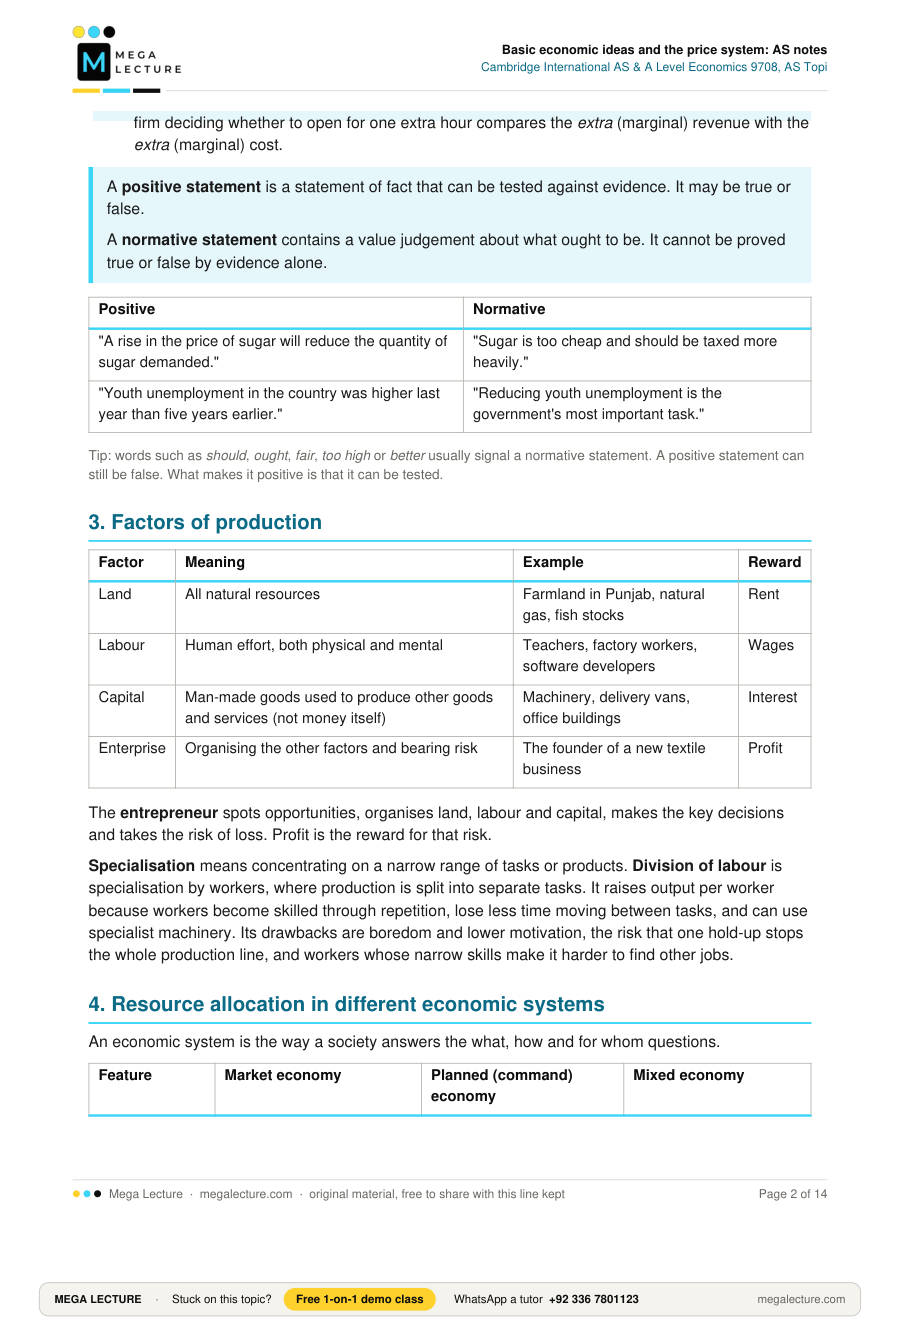
| Feature | Market economy | Planned (command) economy | Mixed economy |
|---|---|---|---|
| Who decides? | Private individuals and firms, through the price mechanism | The state, through central planning | Both the market and the government |
| Ownership of resources | Mainly private | Mainly state | Private and public sectors |
| Main advantages | Consumer sovereignty, incentives to be efficient and innovate, wide choice | Can provide public goods and essentials for all, less inequality, can focus on long-term goals | Tries to combine market efficiency with government action to correct market failure |
| Main disadvantages | Inequality, public goods not provided, merit goods under-consumed, demerit goods over-consumed | Planners lack information, which leads to shortages and surpluses; weak incentives; little choice | Government failure is possible; taxes can reduce incentives |
Background, for context only (not a separate point in the current syllabus wording): countries moving from a planned towards a market system face problems of transition. Prices rise when controls are removed, state firms close and unemployment grows, inequality widens, and the new markets need laws, property rights and banking systems before they can work well.
5. Production possibility curves
A production possibility curve (PPC) shows the maximum combinations of two goods an economy can produce when all its resources are fully and efficiently employed, with a given state of technology.
Diagram in words: good X goes on the horizontal axis and good Y on the vertical axis. The curve joins the two axes and is usually concave to the origin (it bows outwards).
- A point on the curve means resources are fully and efficiently used (productive efficiency).
- A point inside the curve means unemployed or inefficiently used resources.
- A point outside the curve cannot be reached with current resources and technology.
- A movement along the curve shows reallocating resources from one good to the other. The opportunity cost is the amount of the other good given up.
- A movement from a point inside the curve towards the curve shows actual economic growth, because unused resources are brought into use.
- An outward shift of the whole curve shows potential economic growth: an increase in productive capacity. Causes include more or better-quality resources, better technology and more investment in capital. An inward shift can follow a natural disaster, war or a fall in the labour force.
- If technology improves in only one industry, the curve pivots outwards along that good's axis only.
Worked example 1: increasing opportunity cost
A small economy produces wheat and cloth. Its PPC is described by the following points.
| Point | Wheat (000 tonnes) | Cloth (000 metres) | Cloth given up (000 metres) for each extra 10,000 tonnes of wheat |
|---|---|---|---|
| A | 0 | 50 | – |
| B | 10 | 48 | 50 − 48 = 2 |
| C | 20 | 43 | 48 − 43 = 5 |
| D | 30 | 35 | 43 − 35 = 8 |
| E | 40 | 22 | 35 − 22 = 13 |
| F | 50 | 0 | 22 − 0 = 22 |
Step 1: find the change in cloth for each extra 10,000 tonnes of wheat (last column).
Step 2: opportunity cost per 1,000 tonnes of wheat between D and E = 13 ÷ 10 = 1.3 thousand metres of cloth, i.e. 1.3 metres of cloth per tonne of wheat.
Step 3: interpret. The opportunity cost of wheat rises from 2 to 22 thousand metres of cloth per 10,000 tonnes. This happens because resources are not equally suited to both goods. The land and workers moved first are the ones best at wheat and worst at cloth. Later, the economy has to move resources that are very good at cloth and poor at wheat. This is why the PPC is concave.
If resources were equally suited to both goods, the opportunity cost would be constant and the PPC would be a straight line.
6. Classification of goods and services
| Type | Key characteristics | Example |
|---|---|---|
| Free good | Not scarce, so its opportunity cost is zero | Air to breathe, sunlight |
| Private good | Excludable (non-payers can be stopped from using it) and rival (one person's use reduces what is left for others) | A bottle of juice, a mobile phone |
| Public good | Non-excludable and non-rival | Street lighting, flood defences, national defence |
| Merit good | More beneficial than consumers realise, so it is under-consumed if left to the market | Education, vaccinations |
| Demerit good | More harmful than consumers realise, so it is over-consumed if left to the market | Cigarettes, sugary drinks |
Why the market fails to provide public goods: because the good is non-excludable, people can enjoy it without paying. This is the free-rider problem, and it means a private firm cannot collect enough revenue to make a profit. Because the good is non-rival, the marginal cost of one more user is zero, so charging a price would not be efficient either. As a result, public goods are usually provided by the government and paid for through taxation. Some goods are quasi-public: they are only partly non-excludable or non-rival. A toll road is excludable, and it becomes rival when it is congested.
Information failure is the key idea behind merit and demerit goods. Consumers do not have full or accurate information about the long-term benefits or costs, so their private decisions lead to under- or over-consumption compared with what is best for them. Whether something counts as a merit or demerit good partly involves a value judgement.
7. Demand
Effective demand is the quantity of a good or service that consumers are willing and able to buy at a given price over a given period of time.
A want without the ability to pay is not effective demand. Market demand is the sum of all the individual demands at each price. On a diagram, the individual demand curves are added horizontally.
The demand curve slopes down from left to right: as price falls, quantity demanded rises, ceteris paribus. There are two reasons. First, the good becomes cheaper compared with substitutes. Second, consumers' real income rises, so they can afford more.
| Change | Cause | What happens on the diagram | Correct wording |
|---|---|---|---|
| Movement along the curve | Change in the good's own price | Move to a new point on the same curve | Extension (price falls) or contraction (price rises) of demand |
| Shift of the curve | Change in any other determinant | The whole curve moves right (increase) or left (decrease) | Increase or decrease in demand |
Determinants that shift demand: consumers' income, the prices of substitutes and complements, tastes and fashion, advertising, the size and age structure of the population, expectations of future prices, and changes in taxes on income or in welfare benefits.
8. Supply
Supply is the quantity of a good or service that producers are willing and able to sell at a given price over a given period of time.
Market supply is the sum of the quantities all producers are willing and able to supply at each price. On a diagram, the individual supply curves are added horizontally.
The supply curve slopes up from left to right. A higher price makes production more profitable, which encourages existing firms to produce more and new firms to enter. A higher price also covers the rising costs of producing extra units.
Determinants that shift supply: costs of production (wages, raw materials, energy), technology, indirect taxes (shift left) and subsidies (shift right), the number of firms, weather and natural events (important in farming), the prices of other goods the firm could make with the same resources, and firms' expectations. A price change causes an extension or contraction of supply. Any other change causes an increase (rightward shift) or decrease (leftward shift) in supply.
9. Price elasticity of demand (PED)
Price elasticity of demand measures the responsiveness of quantity demanded to a change in the good's own price.
PED = % change in quantity demanded ÷ % change in price
% change = (change ÷ original value) × 100
PED is normally negative because price and quantity demanded move in opposite directions. Economists often discuss its size (ignoring the minus sign), but keep the sign in your calculations.
| Value (ignoring sign) | Description | Shape of the demand curve |
|---|---|---|
| 0 | Perfectly inelastic | Vertical |
| Between 0 and 1 | Inelastic: quantity changes proportionately less than price | Relatively steep |
| 1 | Unitary elasticity | A rectangular hyperbola (price × quantity is the same at every point) |
| Greater than 1 | Elastic: quantity changes proportionately more than price | Relatively flat |
| Infinity (∞) | Perfectly elastic | Horizontal |
Determinants of PED: the number and closeness of substitutes (the most important), the share of income spent on the good, whether it is a necessity or a luxury, whether it is habit-forming, how broadly the product is defined (the demand for "food" is less elastic than the demand for one brand of biscuit), and the time period (demand becomes more elastic over time as consumers find alternatives).
PED and total revenue (total revenue = price × quantity):
- Demand is inelastic: raising price raises total revenue, and cutting price lowers it.
- Demand is elastic: raising price lowers total revenue, and cutting price raises it.
- Unitary elasticity: total revenue does not change when price changes.
Along a straight-line demand curve the slope is constant but PED is not. At high prices and low quantities, a given price change is a small percentage of price but a large percentage of quantity, so demand is elastic. PED equals −1 at the midpoint. Below the midpoint demand is inelastic. Slope and elasticity are therefore different things.
Worked example 2: inelastic demand
A bus company raises its fare from Rs 50 to Rs 60. Daily passengers fall from 10,000 to 9,000. Calculate the PED and explain what happens to total revenue.
Step 1: % change in quantity demanded = (9,000 − 10,000) ÷ 10,000 × 100 = −10%
Step 2: % change in price = (60 − 50) ÷ 50 × 100 = +20%
Step 3: PED = −10 ÷ 20 = −0.5
Step 4: interpret. Demand is price inelastic, because quantity falls proportionately less than price rises. Many passengers have no close substitute for the bus.
Step 5: check revenue. Before: 50 × 10,000 = Rs 500,000. After: 60 × 9,000 = Rs 540,000. Total revenue rises by Rs 40,000, which is what we expect when demand is inelastic.
Worked example 3: elastic demand
A soft-drink brand cuts its price from Rs 80 to Rs 72. Weekly sales in a town rise from 2,000 to 2,500 bottles.
Step 1: % change in quantity demanded = (2,500 − 2,000) ÷ 2,000 × 100 = +25%
Step 2: % change in price = (72 − 80) ÷ 80 × 100 = −10%
Step 3: PED = 25 ÷ −10 = −2.5, so demand is price elastic, because there are many competing brands.
Step 4: total revenue before = 80 × 2,000 = Rs 160,000. After = 72 × 2,500 = Rs 180,000. The price cut raises revenue by Rs 20,000.
10. Income elasticity and cross elasticity of demand
Income elasticity of demand (YED) = % change in quantity demanded ÷ % change in income
Cross elasticity of demand (XED) = % change in quantity demanded of good A ÷ % change in price of good B
| Measure | Sign and size | Meaning |
|---|---|---|
| YED | Positive | Normal good: demand rises as income rises |
| YED | Between 0 and +1 | Normal, income inelastic (often a necessity) |
| YED | Greater than +1 | Normal, income elastic (often a luxury) |
| YED | Negative | Inferior good: demand falls as income rises |
| XED | Positive | Substitutes: a higher price of B raises demand for A |
| XED | Negative | Complements: a higher price of B lowers demand for A |
| XED | Zero | Unrelated goods |
The larger the XED value (ignoring sign), the closer the relationship between the two goods.
Worked example 4: YED
A household's monthly income rises from Rs 50,000 to Rs 60,000, which is (10,000 ÷ 50,000) × 100 = +20%.
Restaurant meals rise from 8 to 12 a month: (4 ÷ 8) × 100 = +50%. YED = 50 ÷ 20 = +2.5. This is a normal good and income elastic, so it behaves like a luxury.
Low-grade rice falls from 20 kg to 18 kg a month: (−2 ÷ 20) × 100 = −10%. YED = −10 ÷ 20 = −0.5. This is an inferior good: the household switches to better-quality rice as it becomes richer.
Worked example 5: XED
(a) The price of tea rises from Rs 400 to Rs 500 per pack (+25%). Café sales of coffee rise from 200 to 230 cups a day: (30 ÷ 200) × 100 = +15%. XED = 15 ÷ 25 = +0.6. The goods are substitutes, but not very close ones.
(b) The price of printers falls by 10%. Sales of ink cartridges rise by 30%. XED = 30 ÷ −10 = −3. The goods are strong complements.
Uses for firms: PED guides pricing decisions. PED, together with PES, shows how much of an indirect tax a firm can pass on to consumers (the more inelastic demand is, the more can be passed on). YED helps firms predict sales as the economy grows or shrinks, and plan which products to offer. XED shows which products are rivals, and whether complements can be priced together (a cheap console with expensive games, for example). Uses for government: taxing goods with inelastic demand raises a lot of revenue, and YED helps it plan for future demand for services.
11. Price elasticity of supply (PES)
Price elasticity of supply measures the responsiveness of quantity supplied to a change in price.
PES = % change in quantity supplied ÷ % change in price
PES is normally positive. PES = 0 is perfectly inelastic (a vertical supply curve), between 0 and 1 is inelastic, 1 is unitary, greater than 1 is elastic, and ∞ is perfectly elastic (a horizontal supply curve). For a straight-line supply curve, the point where it meets an axis tells you the type:
- It passes through the origin: PES = 1 at every point.
- It meets the price axis: PES > 1 (elastic).
- It meets the quantity axis: PES < 1 (inelastic).
Determinants of PES: the time period (supply becomes more elastic in the long run), spare capacity, the level of stocks, how easily factors of production can be moved between uses, the length of the production process (crops take months to grow), and how easily new firms can enter the industry.
Worked example 6: PES
The price of wheat rises from Rs 3,000 to Rs 3,600 per 40 kg. In the same season, the quantity that farmers supply rises from 500 to 540 tonnes.
Step 1: % change in quantity supplied = (40 ÷ 500) × 100 = +8%
Step 2: % change in price = (600 ÷ 3,000) × 100 = +20%
Step 3: PES = 8 ÷ 20 = 0.4, so supply is price inelastic.
Step 4: interpret. Within one season, farmers can only sell from stocks or harvest a little more carefully. Land cannot be replanted quickly. Over the next few years PES is likely to be higher.
12. The interaction of demand and supply
Equilibrium is the price at which quantity demanded equals quantity supplied, so there is no tendency for the price to change.
Worked example 7: equilibrium and a shift in demand
Weekly market for mangoes in a city (quantities in thousand kg).
| Price (Rs per kg) | Quantity demanded (original) | Quantity supplied | Excess demand (+) or supply (−) | Quantity demanded after incomes rise |
|---|---|---|---|---|
| 100 | 20 | 80 | −60 | 35 |
| 80 | 30 | 60 | −30 | 45 |
| 70 | 35 | 50 | −15 | 50 |
| 60 | 40 | 40 | 0 | 55 |
| 40 | 50 | 20 | +30 | 65 |
Step 1: the original equilibrium is at Rs 60 per kg and 40,000 kg, where the demand and supply columns are equal.
Step 2: at Rs 80 there is excess supply of 60 − 30 = 30 thousand kg. Sellers are left with unsold mangoes, so they cut the price. Demand extends and supply contracts until the price returns to Rs 60.
Step 3: at Rs 40 there is excess demand of 30 thousand kg. Buyers compete for the limited supply and bid the price up, so supply extends and demand contracts until the price reaches Rs 60.
Step 4: consumers' incomes rise. Mangoes are a normal good, so demand increases by 15 thousand kg at every price (last column): the demand curve shifts to the right. At the old price of Rs 60 there is now excess demand of 55 − 40 = 15 thousand kg.
Step 5: the price rises, and supply extends along the unchanged supply curve. The new equilibrium is at Rs 70 and 50,000 kg, where the new quantity demanded equals quantity supplied.
Diagram in words: D1 shifts right to D2. The supply curve does not move. The equilibrium moves up along S from 40 thousand kg at Rs 60 to 50 thousand kg at Rs 70.
Summary of shifts (with the other curve unchanged):
| Change | Equilibrium price | Equilibrium quantity |
|---|---|---|
| Increase in demand (D shifts right) | Rises | Rises |
| Decrease in demand (D shifts left) | Falls | Falls |
| Increase in supply (S shifts right) | Falls | Rises |
| Decrease in supply (S shifts left) | Rises | Falls |
When both curves shift at once, the effect on one of the two variables depends on which shift is larger. For example, if demand and supply both increase, quantity definitely rises but price may rise, fall or stay the same. The elasticity of the curve that does not shift decides how much of the change shows up in price and how much in quantity. For example, when demand rises and supply is inelastic, price rises a lot and quantity only a little.
Related markets:
- Joint demand (complements): goods used together, such as cars and petrol. A fall in car prices raises the demand for petrol.
- Alternative (competitive) demand (substitutes): tea and coffee. A rise in the price of one raises demand for the other.
- Derived demand: demand for something that comes from the demand for what it helps produce. The demand for construction workers is derived from the demand for new buildings.
- Joint supply: producing one good automatically produces another. Ginning raw cotton produces both cotton lint and cottonseed (used for cottonseed oil). If more lint is produced because the demand for lint rises, more cottonseed is produced too, which shifts the supply of cottonseed to the right.
Functions of the price mechanism:
- Signalling: price changes send information to producers and consumers, for example that a good has become scarcer.
- Incentive: a higher price encourages firms to produce more because it is more profitable, and a lower price encourages consumers to buy more.
- Rationing: when a good is scarce, the price rises until only those most willing and able to pay buy it.
- Transmission of preferences: through their spending, consumers show which goods they want. This moves resources towards those goods.
13. Consumer and producer surplus
Consumer surplus is the difference between the total amount consumers are willing to pay for a good and the amount they actually pay.
Producer surplus is the difference between the price producers actually receive and the minimum price at which they would be willing to supply.
Diagram in words: consumer surplus is the triangle below the demand curve and above the market price, running from the price axis to the equilibrium quantity. Producer surplus is the triangle above the supply curve and below the market price. With straight-line curves, each area = ½ × base × height.
Worked example 8: calculating surpluses
Use the original mango market from Worked example 7. From the table, demand falls by 10 thousand kg for every Rs 20 rise in price, so the demand curve meets the price axis (quantity = 0) at Rs 140. Supply falls by 20 thousand kg for every Rs 20 fall in price, so the supply curve meets the price axis at Rs 20. Equilibrium: Rs 60 and 40 thousand kg.
Step 1: consumer surplus = ½ × 40,000 × (140 − 60) = ½ × 40,000 × 80 = Rs 1,600,000 per week.
Step 2: producer surplus = ½ × 40,000 × (60 − 20) = ½ × 40,000 × 40 = Rs 800,000 per week.
Step 3: interpret. Buyers as a group would have been willing to pay Rs 1.6 million more than they actually paid. Sellers receive Rs 0.8 million more than the minimum they would have accepted.
Changes in surplus: when a price rises because supply decreases, consumer surplus falls for two reasons: consumers pay more for each unit they still buy, and they buy fewer units. When demand increases, the price rises and more is sold, so producer surplus increases. Consumer surplus may rise or fall, depending on how the curve shifts.
Key terms
| Term | Definition |
|---|---|
| Scarcity | Wants are unlimited but the resources to satisfy them are limited |
| Opportunity cost | The value of the next best alternative given up when a choice is made |
| Ceteris paribus | Assuming all other things remain equal |
| Positive statement | A statement that can be tested against evidence |
| Normative statement | A statement containing a value judgement that cannot be tested by evidence alone |
| Short run | A period in which at least one factor of production is fixed |
| Long run | A period in which all factors of production can be changed |
| Division of labour | Splitting production into separate tasks, each done by different workers |
| Production possibility curve | The maximum combinations of two goods that can be produced with full and efficient use of given resources and technology |
| Actual growth | An increase in output, e.g. using unemployed resources (a move from inside the PPC towards it) |
| Potential growth | An increase in productive capacity (an outward shift of the PPC) |
| Public good | A good that is non-excludable and non-rival |
| Free-rider problem | People benefit from a good without paying for it, so it is not profitable to supply it privately |
| Merit good | A good that is under-consumed in a free market because consumers underestimate its benefits |
| Demerit good | A good that is over-consumed in a free market because consumers underestimate its harm |
| Effective demand | Demand backed by the ability to pay |
| Market supply | The total quantity all producers are willing and able to supply at each price |
| Price elasticity of demand | % change in quantity demanded ÷ % change in price |
| Income elasticity of demand | % change in quantity demanded ÷ % change in income |
| Cross elasticity of demand | % change in quantity demanded of good A ÷ % change in price of good B |
| Price elasticity of supply | % change in quantity supplied ÷ % change in price |
| Inferior good | A good with negative YED |
| Equilibrium price | The price at which quantity demanded equals quantity supplied |
| Derived demand | Demand for a good or factor that comes from the demand for another product |
| Consumer surplus | The difference between what consumers are willing to pay and what they actually pay |
| Producer surplus | The difference between the price received and the minimum price producers would accept |
Quick check
- Define opportunity cost. [2]
- State the four factors of production and the reward to each. [4]
- Identify whether each statement is positive or normative. (a) "Petrol prices in the country rose by 12% last year." (b) "The government should subsidise public transport." [2]
- Explain the difference between a movement along a demand curve and a shift of a demand curve. [3]
- A product's price rises from Rs 200 to Rs 250, and quantity demanded falls from 800 to 700 units. Calculate the PED, and state what happens to total revenue. [3]
- Consumers' incomes rise by 10%. Quantity demanded of a product falls from 500 to 480 units. Calculate the YED and identify the type of good. [3]
- An economy's PPC includes these points: (tractors, food) = (0, 100), (5, 95), (10, 85), (15, 70), (20, 50), (25, 0). Calculate the opportunity cost of increasing tractor output from 10 to 15, and explain why the opportunity cost of tractors increases. [4]
- Explain two reasons why a public good would not be provided by a free market. [4]
- Explain, describing the demand and supply diagram in words, the effect on the market for cotton cloth of a fall in the price of raw cotton. [4]
- A straight-line demand curve meets the price axis at Rs 90. The market price is Rs 50 and 400 units are sold. (a) Calculate consumer surplus. (b) The price rises to Rs 60 and quantity falls to 300 units along the same demand curve. Calculate the change in consumer surplus. [4]
- A bus company estimates PED at −0.4 for peak-time travel and −1.6 for off-peak travel. Analyse how it could use this information to increase total revenue. [6]
- The price of a good rises by 10% and quantity supplied rises by 15%. Calculate PES and state one reason why supply may be elastic. [2]
- Assess whether a mixed economy allocates resources better than a market economy. [12]
1. The value of the next best alternative [1] given up when a choice is made [1].
2. Land – rent; labour – wages; capital – interest; enterprise – profit [1 each].
3. (a) Positive, because it can be checked against data [1]. (b) Normative, because it contains a value judgement ("should") [1].
4. A movement along the curve is caused only by a change in the good's own price and is called an extension or a contraction [1]. A shift is caused by a change in any other determinant, such as income or the price of a substitute [1]. After a shift, a different quantity is demanded at every price, so the whole curve moves right (increase) or left (decrease) [1].
5. % change in Qd = (700 − 800) ÷ 800 × 100 = −12.5%, and % change in P = (250 − 200) ÷ 200 × 100 = +25% [1]. PED = −12.5 ÷ 25 = −0.5 (inelastic) [1]. Total revenue rises from 200 × 800 = Rs 160,000 to 250 × 700 = Rs 175,000, an increase of Rs 15,000 [1].
6. % change in Qd = (480 − 500) ÷ 500 × 100 = −4% [1]. YED = −4 ÷ 10 = −0.4 [1]. The negative sign shows this is an inferior good [1].
7. Food falls from 85 to 70, so the opportunity cost is 15 units of food for 5 tractors [1], which is 3 units of food per tractor [1]. The opportunity cost of each extra 5 tractors rises (5, 10, 15, 20, then 50 units of food) because resources are not equally suited to both goods [1]. The resources moved first are good at making tractors and poor at farming. Later, the economy has to move good farmland and skilled farm workers, so more food is lost for each tractor gained [1].
8. Non-excludability: once the good is provided, non-payers cannot be stopped from using it. People can therefore free ride, and a firm cannot collect enough revenue to make a profit [2]. Non-rivalry: one more person's use does not reduce what is available to others, so the marginal cost of an extra user is zero. Charging a price would stop some people using a good that costs nothing extra to provide, and it is hard to find a price that works [2].
9. Raw cotton is a cost of production for cloth, so costs fall [1]. The supply of cloth increases: the supply curve shifts to the right [1]. At the original price there is excess supply, so the price falls [1]. Demand extends along the unchanged demand curve until the new equilibrium, with a lower price and a higher quantity [1].
10. (a) CS = ½ × 400 × (90 − 50) = ½ × 400 × 40 = Rs 8,000 [2]. (b) New CS = ½ × 300 × (90 − 60) = ½ × 300 × 30 = Rs 4,500. Change = 4,500 − 8,000 = a fall of Rs 3,500 [2].
11. Peak demand is inelastic (0.4 < 1) because commuters must travel at fixed times and have few alternatives. A higher peak fare reduces passenger numbers proportionately less than the fare rises, so peak revenue increases [2]. Off-peak demand is elastic (1.6 > 1) because these trips are optional or can be made another way. A lower off-peak fare increases passengers proportionately more than the fare falls, so off-peak revenue also increases [2]. Development, for example a numerical illustration: a 10% rise in the peak fare cuts peak passengers by about 4%, and a 10% cut in the off-peak fare raises off-peak passengers by about 16%, so revenue rises in both periods [2]. Charging different fares at different times is a pricing strategy you will meet again at A Level.
Beyond the question (evaluation, not required for Analyse): the estimates may be inaccurate or out of date; some peak travellers may switch to off-peak, which reduces the gain; the extra off-peak passengers may add costs; and higher revenue does not guarantee higher profit.
12. PES = 15 ÷ 10 = 1.5, so supply is price elastic [1]. One reason, e.g. firms have spare capacity or large stocks, or factors of production can easily be moved into making this good [1].
13. Case for a mixed economy: the government can provide public goods that the market would not provide. It can encourage consumption of merit goods such as education and discourage demerit goods. It can reduce inequality through taxes and transfers. Meanwhile it keeps the price mechanism, with its incentives and consumer sovereignty, for most goods. Case against: government failure is possible. The state may lack information, respond to political pressure, or run public-sector firms inefficiently without a profit motive. High taxes can weaken incentives to work and invest. Judgement: the answer depends on the balance between the two sectors and on the quality of government. A mixed economy is likely to allocate resources better where market failure is significant (public goods, information failure) and where the government is well informed and accountable. Where government is weak, a larger market sector may give a better outcome.
Marking guide (levels-style): knowledge and analysis up to 8 marks. 6–8 for developed, accurate analysis of both sides; 3–5 for analysis that is one-sided or partly developed; 1–2 for relevant points with little explanation. Evaluation up to 4 marks. 3–4 for a judgement that is supported by the analysis and says what it depends on; 1–2 for a conclusion that is stated but only weakly supported.
