
GCSE · Biology · AQA GCSE Biology Notes: Ecology (Topic 7)
AQA GCSE Biology Notes: Ecology (Topic 7)
Opens inside this page. Prefer your own PDF app? Open the PDF.
Check yourself
5 quick questions on GCSE Biology
Tap an answer to see if you are right, and why. Free, no sign-up.
Start the free testWas this note useful?
Full text of AQA GCSE Biology Notes: Ecology (Topic 7)
These notes cover Topic 7: Ecology from the AQA GCSE Biology specification (8461), examined on Paper 2. Most of this content, at reduced depth, is also examined within AQA GCSE Combined Science: Trilogy (8464), also on Paper 2; sections or notes marked Biology only are not included in the Trilogy specification. The notes cover communities and abiotic and biotic factors, organism adaptations including extremophiles, food chains and predator-prey population cycles, sampling with quadrats and transects, levels of organisation and trophic levels, pyramids of biomass and percentage biomass transfer, the carbon cycle, the water cycle (Biology only), decomposition and the factors that affect its rate, and biodiversity, including the effects of human activity and ways of maintaining it. Sections headed "Required practical" describe the two required practical activities for this topic; the decomposition practical is Biology only and is not assessed in Combined Science. Food production (specification section 4.7.5, Biology only) is not covered here and is treated in a separate notes page.
Communities, and abiotic and biotic factors
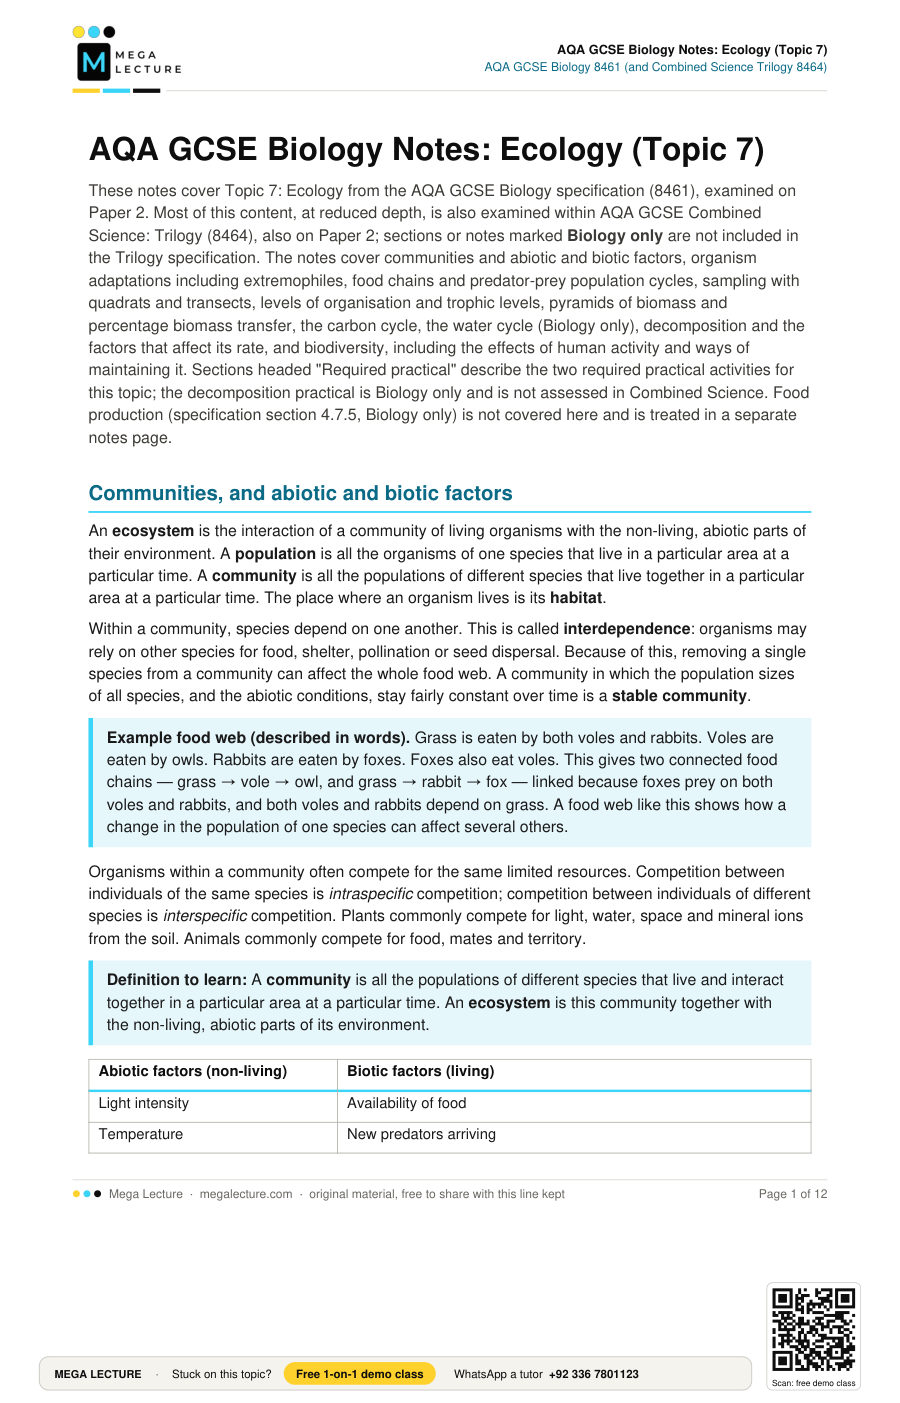
An ecosystem is the interaction of a community of living organisms with the non-living, abiotic parts of their environment. A population is all the organisms of one species that live in a particular area at a particular time. A community is all the populations of different species that live together in a particular area at a particular time. The place where an organism lives is its habitat.
Within a community, species depend on one another. This is called interdependence: organisms may rely on other species for food, shelter, pollination or seed dispersal. Because of this, removing a single species from a community can affect the whole food web. A community in which the population sizes of all species, and the abiotic conditions, stay fairly constant over time is a stable community.
Example food web (described in words). Grass is eaten by both voles and rabbits. Voles are eaten by owls. Rabbits are eaten by foxes. Foxes also eat voles. This gives two connected food chains — grass → vole → owl, and grass → rabbit → fox — linked because foxes prey on both voles and rabbits, and both voles and rabbits depend on grass. A food web like this shows how a change in the population of one species can affect several others.
Organisms within a community often compete for the same limited resources. Competition between individuals of the same species is intraspecific competition; competition between individuals of different species is interspecific competition. Plants commonly compete for light, water, space and mineral ions from the soil. Animals commonly compete for food, mates and territory.
Definition to learn: A community is all the populations of different species that live and interact together in a particular area at a particular time. An ecosystem is this community together with the non-living, abiotic parts of its environment.
| Abiotic factors (non-living) | Biotic factors (living) |
|---|---|
| Light intensity | Availability of food |
| Temperature | New predators arriving |
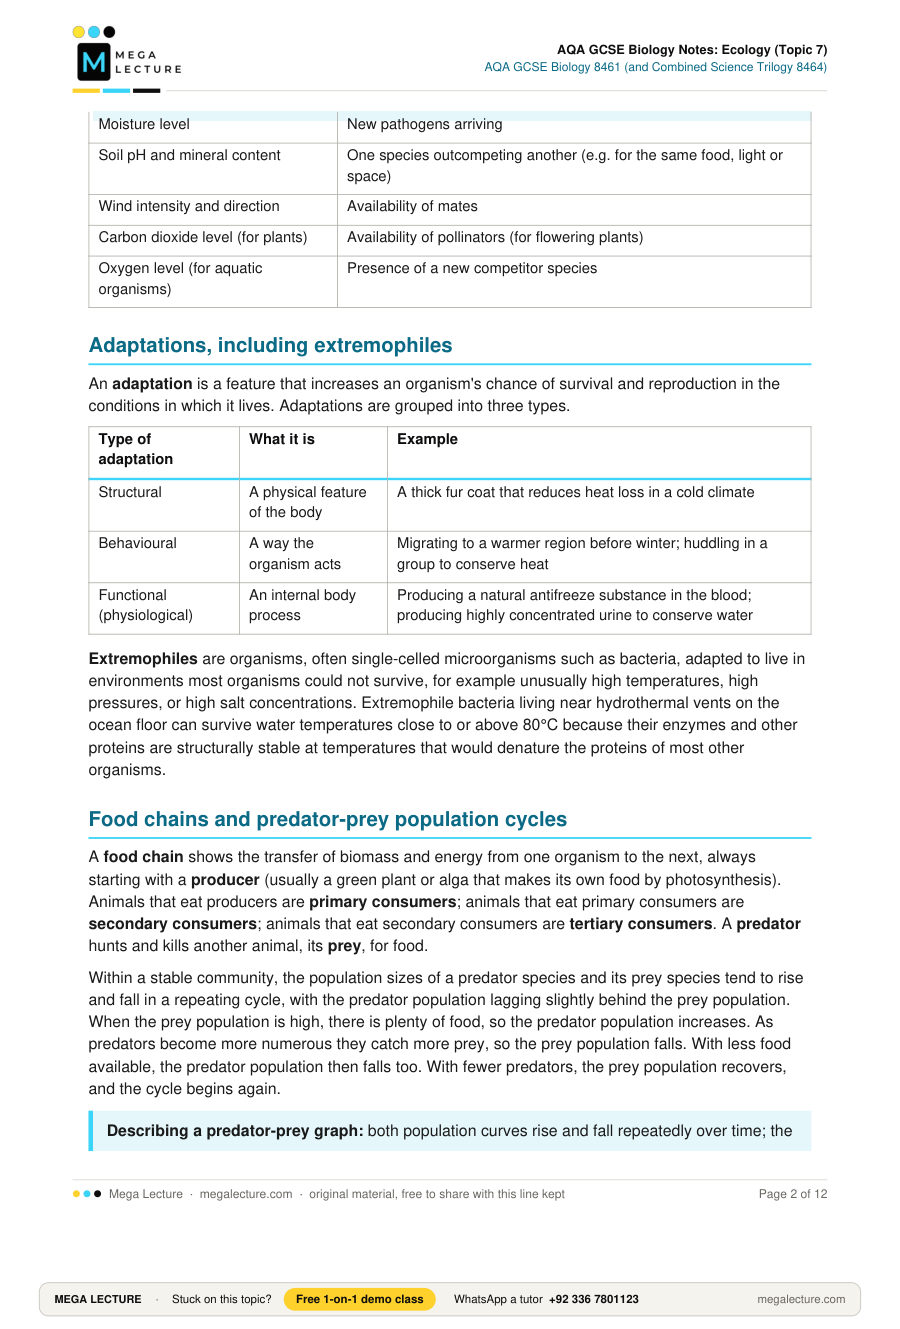
| Moisture level | New pathogens arriving |
| Soil pH and mineral content | One species outcompeting another (e.g. for the same food, light or space) |
| Wind intensity and direction | Availability of mates |
| Carbon dioxide level (for plants) | Availability of pollinators (for flowering plants) |
| Oxygen level (for aquatic organisms) | Presence of a new competitor species |
Adaptations, including extremophiles
An adaptation is a feature that increases an organism's chance of survival and reproduction in the conditions in which it lives. Adaptations are grouped into three types.
| Type of adaptation | What it is | Example |
|---|---|---|
| Structural | A physical feature of the body | A thick fur coat that reduces heat loss in a cold climate |
| Behavioural | A way the organism acts | Migrating to a warmer region before winter; huddling in a group to conserve heat |
| Functional (physiological) | An internal body process | Producing a natural antifreeze substance in the blood; producing highly concentrated urine to conserve water |
Extremophiles are organisms, often single-celled microorganisms such as bacteria, adapted to live in environments most organisms could not survive, for example unusually high temperatures, high pressures, or high salt concentrations. Extremophile bacteria living near hydrothermal vents on the ocean floor can survive water temperatures close to or above 80°C because their enzymes and other proteins are structurally stable at temperatures that would denature the proteins of most other organisms.
Food chains and predator-prey population cycles
A food chain shows the transfer of biomass and energy from one organism to the next, always starting with a producer (usually a green plant or alga that makes its own food by photosynthesis). Animals that eat producers are primary consumers; animals that eat primary consumers are secondary consumers; animals that eat secondary consumers are tertiary consumers. A predator hunts and kills another animal, its prey, for food.
Within a stable community, the population sizes of a predator species and its prey species tend to rise and fall in a repeating cycle, with the predator population lagging slightly behind the prey population. When the prey population is high, there is plenty of food, so the predator population increases. As predators become more numerous they catch more prey, so the prey population falls. With less food available, the predator population then falls too. With fewer predators, the prey population recovers, and the cycle begins again.
Describing a predator-prey graph: both population curves rise and fall repeatedly over time; the predator curve has the same overall shape as the prey curve but is shifted slightly later in time (a time lag); peaks and troughs in the predator population occur shortly after the corresponding peaks and troughs in the prey population.
Sampling techniques: quadrats and transects
Required practical: measuring the population size of an organism in a habitat using sampling techniques (quadrats and transects).
Ecologists sample rather than count every organism, since counting a whole habitat is rarely practical. A quadrat is a square frame of known area, commonly 0.25 m² or 1 m² (other sizes, such as the 0.5 m² quadrats used in the worked example below, are also used depending on the organism and habitat), used to sample slow-moving or non-mobile organisms such as plants.
To estimate population size using quadrats: place quadrats at random positions in the habitat (for example, using randomly generated coordinates along two tape measures laid at right angles, to avoid bias); count the number of individuals of the chosen species, or estimate the percentage cover, in each quadrat; repeat for a large number of quadrats; calculate the mean number per quadrat; then use this mean to estimate the population for the whole area.
A transect is used to study how the distribution of organisms changes across a habitat, for example along an environmental gradient. A line transect is a tape measure laid across the habitat; organisms touching the line at fixed intervals are recorded. A belt transect uses quadrats placed at regular intervals along the line, so abundance, not just presence, is recorded at each point.
Equation: population size estimate = mean number of organisms per quadrat × (total area of habitat ÷ area of one quadrat)
Worked example. A student recorded dandelion plants in ten 0.5 m² quadrats placed at random in a field measuring 60 m × 40 m. The total count across the 10 quadrats was 54 dandelions.
Mean number per quadrat = 54 ÷ 10 = 5.4
Total area of field = 60 × 40 = 2400 m²
Number of quadrat-areas in the field = 2400 ÷ 0.5 = 4800
Population size estimate = 5.4 × 4800 = 25 920 dandelion plants
This is only an estimate, not an exact count, since it is based on a mean taken from a small sample of quadrats. In practice it would be more appropriate to report it as approximately 26 000 dandelion plants.
Levels of organisation and trophic levels
Biological organisation forms a series of levels: an individual organism belongs to a population; a population belongs to a community; a community together with the abiotic conditions of its environment forms an ecosystem.
Within a food chain, each stage is a trophic level.
| Trophic level | Organisms present |
|---|---|
| 1 | Producers (plants and algae) |
| 2 | Primary consumers (herbivores) |
| 3 | Secondary consumers (carnivores that eat herbivores) |
| 4 | Tertiary consumers, often apex predators with no natural predators of their own |
Decomposers (mainly certain bacteria and fungi) break down dead material from every trophic level and are not usually given their own number in a pyramid of biomass.
Pyramids of biomass and percentage biomass transfer
Biomass is the mass of living material, usually measured as dry mass to remove the variable effect of water content. A pyramid of biomass is a diagram in which a bar is drawn for each trophic level, its width drawn to scale to represent the total biomass at that level, with producers at the bottom. Because biomass decreases at each successive trophic level, a pyramid of biomass is always pyramid-shaped, tapering towards the top, unlike a pyramid of numbers, which can sometimes be inverted.
Only a small proportion of the biomass at one trophic level is transferred to the next — typically around 10%. The rest is lost because: much of it is used in respiration, with the energy eventually lost to the surroundings as heat (especially in warm-blooded animals); some is lost as undigested material removed by egestion (faeces); some is lost in waste substances removed by excretion (e.g. urea); and not all parts of an organism (e.g. bones, woody tissue) are eaten by the next consumer.
Equation: percentage biomass transfer = (biomass transferred to next trophic level ÷ biomass available at previous trophic level) × 100
Worked example. In a grassland food chain, producers have a total biomass of 4500 kg. The primary consumers that feed on them have a total biomass of 450 kg. Calculate the percentage of biomass transferred.
Percentage transfer = 450 ÷ 4500 × 100 = 10%
The carbon cycle
Carbon dioxide in the atmosphere is absorbed by plants and algae during photosynthesis and converted into carbon compounds in their biomass. This carbon is transferred along food chains as animals feed on plants and on each other. All living organisms — plants, animals and decomposers — respire, releasing carbon dioxide back into the atmosphere. When organisms die, decomposers break down their remains, and their own respiration releases further carbon dioxide, while some carbon compounds may remain in the soil. Over millions of years, under high pressure and without oxygen, the compressed remains of dead organisms can form fossil fuels such as coal, oil and natural gas. Burning these fuels, a process called combustion, releases the stored carbon as carbon dioxide, completing the cycle.
Word equation for photosynthesis: carbon dioxide + water → glucose + oxygen (light energy required). Word equation for (aerobic) respiration: glucose + oxygen → carbon dioxide + water (energy released).
The water cycle
Biology only: the water cycle is not included in the AQA Combined Science: Trilogy specification.
The water cycle supplies fresh water to the land and is driven by energy from the sun. Heat causes evaporation of water from oceans, rivers and lakes, turning liquid water into water vapour. Plants also lose water vapour from their leaves through transpiration. As water vapour rises into cooler air it condenses into tiny droplets, which collect as clouds. When droplets become heavy enough, water falls as precipitation (rain, snow, sleet or hail). This water collects in rivers and lakes and flows back towards the sea, while some soaks into the ground, providing the fresh water that plants and animals, including humans, depend on for drinking and irrigation.
Decomposition and factors affecting its rate
Required practical (Biology only): investigating the effect of temperature on the rate of decomposition, measured through a change in pH.
Decomposers — mainly certain bacteria and fungi — break down dead plant and animal matter and waste products. They secrete enzymes onto the material to digest it outside their own cells, then absorb the small, soluble molecules produced. Decomposition returns carbon dioxide and mineral ions to the environment, making nutrients available for new plant growth.
The rate of decomposition is affected by:
- Temperature — as temperature rises towards the decomposers' optimum (typically around 35–40°C for many soil microorganisms), the rate of decomposition increases; above this, the rate falls sharply as enzymes are denatured.
- Water availability — decomposers need moisture to grow and carry out their reactions; decomposition is much slower in very dry conditions.
- Oxygen availability — decomposition is generally faster in oxygen-rich, aerobic conditions than in oxygen-poor, anaerobic conditions, although some decomposers work anaerobically (e.g. in biogas production).
Required practical method: Prepare several identical dilute milk mixtures, each containing an alkali and a pH indicator, so each starts off alkaline in colour. Add the same volume and concentration of a fat-digesting enzyme (e.g. lipase) to each, modelling the enzymes released by decomposers. Hold each mixture at a different fixed temperature using water baths, keeping every other variable (volume, concentration, starting pH, enzyme volume) constant. As decomposition proceeds, fatty acids and other acidic products lower the pH, changing the indicator's colour; time how long this takes at each temperature. Calculate rate as 1 ÷ time taken.
Expected pattern: rate of decomposition increases as temperature rises towards an optimum of around 35–40°C, then decreases at higher temperatures as the enzymes are denatured.
Biodiversity and the effects of human activity
Biodiversity is the variety of different species of organisms living in an ecosystem or on Earth as a whole. A high level of biodiversity helps ensure the stability of ecosystems, by reducing the dependence of any one species on a single other species for food, shelter or other resources. Rapid human population growth, together with rising standards of living, is increasing the rate at which resources are used and waste is produced, putting increasing pressure on biodiversity worldwide.
| Human activity | Main effects on ecosystems and biodiversity |
|---|---|
| Waste production | Sewage, plastics and chemical waste can pollute water (fertiliser and sewage), air (smoke, acidic gases) and land (pesticides, herbicides), reducing biodiversity. |
| Land use | Building, quarrying, farming and dumping waste reduce the land available for other organisms and destroy or fragment habitats. |
| Deforestation | Large-scale clearing of forest, especially in the tropics, for cattle grazing, rice fields and biofuel crops destroys habitats and reduces biodiversity. |
| Global warming | Rising temperatures shift species distributions, disrupt migration and breeding patterns, and contribute to melting ice and rising sea levels, which can flood habitats. |
Deforestation also contributes to global warming: fewer trees means less carbon dioxide is absorbed by photosynthesis, and burning cleared vegetation releases stored carbon rapidly as carbon dioxide. Human activities, particularly fossil fuel combustion and deforestation, have increased the concentration of greenhouse gases such as carbon dioxide and methane in the atmosphere. These gases enhance the greenhouse effect, trapping more heat and causing global warming.
Ways of maintaining biodiversity
- Breeding programmes for endangered species, with reintroduction of captive-bred individuals to the wild.
- Protection and regeneration of rare or threatened habitats, such as wetlands and ancient woodland.
- Reintroduction of hedgerows and field margins around farmland to provide food and shelter for wildlife.
- Reducing the rate of deforestation and encouraging replanting of trees.
- Recycling materials and reducing waste, to reduce the amount of land needed for landfill.
- International agreements and government targets to reduce greenhouse gas emissions.
Key terms
| Term | Definition |
|---|---|
| Ecology | The study of the interactions between organisms and each other, and between organisms and their environment. |
| Ecosystem | The interaction of a community of living organisms with the abiotic parts of their environment. |
| Habitat | The place where an organism lives. |
| Population | All the organisms of one species living in a particular area at a particular time. |
| Community | All the populations of different species living together in a particular area at a particular time. |
| Interdependence | The way organisms in a community rely on other species for food, shelter, pollination or seed dispersal. |
| Stable community | A community in which population sizes and abiotic conditions remain fairly constant over time. |
| Abiotic factor | A non-living factor that affects a community, such as temperature or light intensity. |
| Biotic factor | A living factor that affects a community, such as a predator or a pathogen. |
| Light intensity | The amount of light reaching an area, affecting the rate of photosynthesis. |
| Soil pH and mineral content | The acidity and nutrient content of soil, affecting which plants can grow. |
| Wind intensity and direction | An abiotic factor affecting transpiration rate and plant growth. |
| Carbon dioxide level | The concentration of carbon dioxide available for photosynthesis. |
| Oxygen level | The concentration of dissolved oxygen, particularly important in aquatic habitats. |
| Competition | When organisms need the same limited resource, such as food, light, water or mates. |
| Interspecific competition | Competition between organisms of different species. |
| Intraspecific competition | Competition between organisms of the same species. |
| Predator | An animal that hunts and kills other animals for food. |
| Prey | An animal that is hunted and eaten by a predator. |
| Predator-prey cycle | The repeated rise and fall in the population sizes of a predator and its prey. |
| Pathogen | A microorganism that causes disease. |
| Adaptation | A feature that increases an organism's chance of survival and reproduction. |
| Structural adaptation | A physical feature of an organism's body that helps it survive. |
| Behavioural adaptation | A way an organism acts that helps it survive. |
| Functional (physiological) adaptation | An internal process in an organism's body that helps it survive. |
| Extremophile | An organism adapted to live in extreme conditions such as high temperature, pressure or salinity. |
| Producer | An organism that makes its own food by photosynthesis, forming the first trophic level. |
| Consumer | An organism that gets its energy by eating other organisms. |
| Primary consumer | An animal that eats producers. |
| Secondary consumer | An animal that eats primary consumers. |
| Tertiary consumer | An animal that eats secondary consumers. |
| Apex predator | The top predator in a food chain, with no natural predators of its own. |
| Herbivore | An animal that only eats plants. |
| Carnivore | An animal that only eats other animals. |
| Omnivore | An animal that eats both plants and animals. |
| Decomposer | An organism, such as certain bacteria or fungi, that breaks down dead organic matter. |
| Food chain | A diagram showing the transfer of biomass from one organism to the next. |
| Food web | A network of interconnected food chains in a community. |
| Trophic level | A stage in a food chain occupied by organisms that obtain energy in a similar way. |
| Biomass | The mass of living material in an organism or trophic level. |
| Pyramid of biomass | A diagram showing the biomass of each trophic level in a food chain, drawn to scale. |
| Percentage biomass transfer | The proportion of biomass passed from one trophic level to the next, expressed as a percentage. |
| Quadrat | A square frame of known area used to sample organisms in a habitat. |
| Transect | A line placed across a habitat, used to study changes in distribution across the area. |
| Line transect | A transect in which organisms touching a tape measure at set points are recorded. |
| Belt transect | A transect using quadrats placed at intervals to record abundance along a line. |
| Random sampling | Sampling using randomly generated positions to avoid bias. |
| Percentage cover | An estimate of the quadrat area covered by a particular species. |
| Distribution | Where organisms are found within a habitat or area. |
| Photosynthesis | The process by which plants and algae use light energy to convert carbon dioxide and water into glucose and oxygen. |
| Respiration | The process by which living cells release energy from glucose. |
| Combustion | The burning of a fuel, releasing carbon dioxide into the atmosphere. |
| Decomposition | The breakdown of dead organic matter by decomposers. |
| Carbon cycle | The continuous movement of carbon between the atmosphere, living organisms and the environment. |
| Water cycle | The continuous movement of water between the atmosphere, land and oceans. |
| Evaporation | The change of state of water from liquid to vapour, caused by heat. |
| Transpiration | The loss of water vapour from a plant's surface, mainly through the leaves. |
| Condensation | The change of state of water vapour into liquid water. |
| Precipitation | Water falling from clouds as rain, snow, sleet or hail. |
| Biodiversity | The variety of different species of organisms in an ecosystem or on Earth. |
| Extinction | The permanent disappearance of a species from Earth. |
| Endangered species | A species with a population so small it is at risk of extinction. |
| Deforestation | The large-scale removal of trees, often to provide land for farming. |
| Global warming | The increase in the average temperature of the Earth's atmosphere. |
| Greenhouse effect | The natural trapping of heat by gases in the atmosphere. |
| Greenhouse gas | A gas, such as carbon dioxide or methane, that contributes to the greenhouse effect. |
| Conservation | The protection and careful management of ecosystems, habitats and species. |
| Breeding programme | Breeding endangered species in captivity to increase their population before reintroduction to the wild. |
| Sustainability | Meeting the needs of people today without damaging the ability of future generations to meet their own needs. |
Quick check
- State what is meant by the term population. [1]
- Give two abiotic factors that could affect where a species of plant is able to grow. [2]
- A food web contains the food chains grass → vole → owl and grass → rabbit → fox, with foxes also eating voles. Predict and explain what would happen to the fox population if all the rabbits in this area were removed by disease. [3]
- Describe how a student could use quadrats to estimate the total population of daisy plants growing in a field. [4]
- A belt transect was set up from a hedge into an open field. Percentage cover of daisies was recorded as 5% at 0 m from the hedge, 40% at 5 m, and 65% at 10 m. Light intensity increased steadily over the same distance. Suggest an explanation for this pattern. [3]
- A species of bacterium lives permanently in water at a temperature of about 80°C near a hydrothermal vent. Suggest one adaptation that allows this bacterium to survive in this habitat. [1]
- Explain why the population sizes of a predator and its prey tend to rise and fall in a repeated cycle. [4]
- The producers in a lake ecosystem have a total biomass of 2800 kg. The primary consumers that feed on them have a total biomass of 224 kg. Calculate the percentage of biomass transferred from the producers to the primary consumers. Show your working. [2]
- Explain why the biomass of primary consumers in a food chain is normally much less than the biomass of the producers. [3]
- Describe how carbon from carbon dioxide in the atmosphere can eventually become part of a fossil fuel. [4]
- Explain how large-scale deforestation in tropical regions can contribute to global warming. [4]
- A student wanted to find out how temperature affects the rate of decomposition of milk. Describe a method she could use to investigate this, and explain the pattern of results you would expect her to obtain. [6]
- Explain how a fall in biodiversity caused by deforestation could reduce the stability of an ecosystem. [3]
- Evaluate two different methods that could be used by governments and conservation organisations to help maintain biodiversity. [6]
1. A population is all the organisms of one species living in a particular area at a particular time.
2. Any two of: light intensity, soil pH, soil mineral content, moisture level, temperature, wind intensity/direction — each linked to the growing conditions a plant needs.
3. Foxes eat both rabbits and voles, so if rabbits are removed foxes must rely more heavily on voles as a food source. In the short term the fox population is likely to fall, since there is less food overall available to them; however, foxes may increase their predation on voles to compensate, which could in turn cause the vole population to fall, potentially reducing the food available to owls as well. This shows how removing one species from a food web can affect several other populations.
4. Place quadrats of known area at random positions across the field (e.g. using randomly generated coordinates) to avoid bias. Count the number of daisy plants in each quadrat and repeat for a reasonably large number of quadrats. Calculate the mean number of daisies per quadrat, then multiply this mean by the total area of the field divided by the area of one quadrat, to estimate the population size for the whole field.
5. The hedge blocks or shades light close to it, so light intensity is lowest at 0 m; since daisies need light for photosynthesis, fewer daisies can grow and survive there, giving low percentage cover. Further from the hedge, light intensity increases, allowing daisies to photosynthesise more and grow more densely, so percentage cover increases with distance from the hedge.
6. It is an extremophile whose enzymes and other proteins are structurally stable and continue to function normally at very high temperatures that would denature the proteins of most other organisms.
7. When prey numbers are high there is plenty of food, so the predator population increases; more predators then catch more prey, so the prey population falls; with less prey available the predator population then falls; with fewer predators the prey population recovers, and the cycle repeats, with the predator population lagging slightly behind the prey population.
8. Percentage transfer = 224 ÷ 2800 × 100 = 8%.
9. Not all biomass eaten by primary consumers is used for growth. Some is lost as waste — undigested material removed as faeces (egestion) and waste substances removed by excretion (e.g. urea). Much of what is absorbed is used in respiration, with the energy eventually lost to the surroundings as heat, especially in animals that maintain a constant body temperature. Some parts of the producers, such as woody tissue, may also not be eaten at all. As a result only around 10% of biomass is transferred to the next trophic level.
10. Carbon dioxide is absorbed from the atmosphere by plants during photosynthesis and converted into carbon compounds in their biomass. This carbon passes along food chains as animals feed on the plants and on each other. When plants and animals die, if their remains are not fully decomposed and instead become buried and compressed over millions of years under high pressure and without oxygen, the carbon they contain can eventually form fossil fuels such as coal, oil or natural gas.
11. Trees absorb carbon dioxide during photosynthesis, so removing large numbers of trees reduces the amount of carbon dioxide taken out of the atmosphere. If the cleared vegetation is burned, the carbon stored in it is released rapidly as carbon dioxide. Both effects increase the concentration of carbon dioxide, a greenhouse gas, enhancing the greenhouse effect and contributing to global warming.
12. This is a levels-of-response question. Indicative content includes: preparing several identical dilute milk mixtures, each containing an alkali and a pH indicator, so they start off alkaline; adding the same volume and concentration of a fat-digesting enzyme (e.g. lipase) to each; holding each mixture at a different fixed temperature in water baths while controlling other variables; timing how long it takes for the colour/pH to change and calculating rate as 1 ÷ time taken; and explaining that rate increases as temperature rises towards an optimum of around 35–40°C, then decreases at higher temperatures because the enzymes are denatured.
Level 3 (5–6 marks): a logically sequenced, detailed method that identifies the controlled variables AND a correctly explained pattern linked to enzyme action, using scientific vocabulary throughout, for example: "Prepare several identical dilute milk mixtures, each containing an alkali and a pH indicator, so each starts off alkaline in colour. Add the same volume and concentration of a fat-digesting enzyme (e.g. lipase) to each, then hold each mixture at a different fixed temperature using water baths, keeping every other variable (volume, concentration, starting pH, enzyme volume) constant. Time how long it takes for each mixture to change colour as acidic products of decomposition lower its pH, and calculate rate as 1 ÷ time taken. Expected pattern: rate of decomposition increases as temperature rises towards an optimum of around 35–40°C, then decreases at higher temperatures as the enzymes involved are denatured."
Level 2 (3–4 marks): a mostly complete method OR a mostly complete explanation of the expected pattern, but not both fully linked together, with some detail (such as control of variables, or the reason for the decrease above the optimum) missing.
Level 1 (1–2 marks): brief, unlinked statements, such as stating only that different temperatures or water baths were used, or that "rate changes with temperature" without explaining why.
13. With fewer species present, the remaining organisms become more dependent on a smaller number of other species for food, shelter and other resources, so the loss or decline of just one remaining species is more likely to disrupt feeding relationships throughout the community, making the ecosystem less able to withstand further change.
14. This is a levels-of-response question requiring a weighed judgement with an overall conclusion.
Level 3 (5–6 marks): a detailed, balanced comparison of both methods, with clear strengths and weaknesses of each, AND an explicit overall conclusion, for example: "Breeding programmes can successfully increase the numbers of a critically endangered species and allow individuals to be reintroduced to the wild, but they are often expensive, slow, and only help one species at a time. Protecting and regenerating habitats, such as woodland or wetland, can benefit many different species at once and is often more cost-effective in the long term, but it requires long-term legal protection and cooperation from landowners, and some habitats take many years to recover fully. Overall, habitat protection is generally more effective for maintaining biodiversity broadly and cheaply across many species, whereas breeding programmes are better reserved for species already at critical, near-extinction risk where immediate intervention is needed."
Level 2 (3–4 marks): strengths and weaknesses of both methods are given, but with limited linkage between them or no clear overall judgement.
Level 1 (1–2 marks): brief, unlinked statements about one or both methods, with no real comparison or judgement.
