
A Level · Accounting 9706 · Accounting ratios and analysis of financial statements: A Level notes
Accounting ratios and analysis of financial statements: A Level notes
The Daily 5 Five questions a day on A Level Accounting: two minutes, new every day, with a streak to keep Play today’s →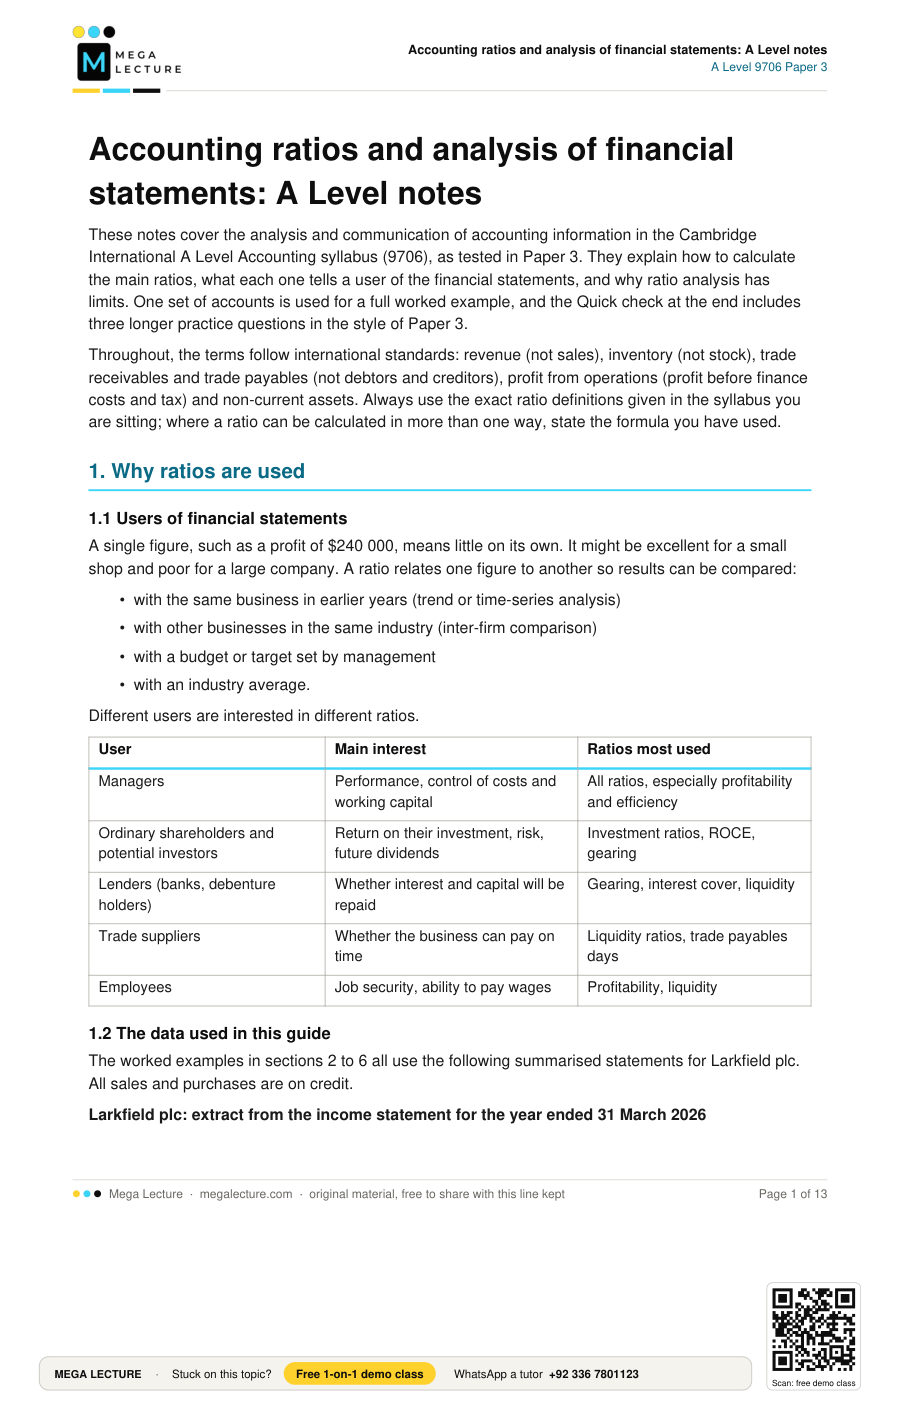
Opens inside this page. Prefer your own PDF app? Open the PDF.
Check yourself
5 quick questions on A Level Accounting
Tap an answer to see if you are right, and why. Free, no sign-up.
Start the free test👍 32 students found these notes useful
Was this note useful?
Full text of Accounting ratios and analysis of financial statements: A Level notes
These notes cover the analysis and communication of accounting information in the Cambridge International A Level Accounting syllabus (9706), as tested in Paper 3. They explain how to calculate the main ratios, what each one tells a user of the financial statements, and why ratio analysis has limits. One set of accounts is used for a full worked example, and the Quick check at the end includes three longer practice questions in the style of Paper 3.
Throughout, the terms follow international standards: revenue (not sales), inventory (not stock), trade receivables and trade payables (not debtors and creditors), profit from operations (profit before finance costs and tax) and non-current assets. Always use the exact ratio definitions given in the syllabus you are sitting; where a ratio can be calculated in more than one way, state the formula you have used.
1. Why ratios are used
1.1 Users of financial statements
A single figure, such as a profit of $240 000, means little on its own. It might be excellent for a small shop and poor for a large company. A ratio relates one figure to another so results can be compared:
- with the same business in earlier years (trend or time-series analysis)
- with other businesses in the same industry (inter-firm comparison)
- with a budget or target set by management
- with an industry average.
Different users are interested in different ratios.
| User | Main interest | Ratios most used |
|---|---|---|
| Managers | Performance, control of costs and working capital | All ratios, especially profitability and efficiency |
| Ordinary shareholders and potential investors | Return on their investment, risk, future dividends | Investment ratios, ROCE, gearing |
| Lenders (banks, debenture holders) | Whether interest and capital will be repaid | Gearing, interest cover, liquidity |
| Trade suppliers | Whether the business can pay on time | Liquidity ratios, trade payables days |
| Employees | Job security, ability to pay wages | Profitability, liquidity |
1.2 The data used in this guide
The worked examples in sections 2 to 6 all use the following summarised statements for Larkfield plc. All sales and purchases are on credit.
Larkfield plc: extract from the income statement for the year ended 31 March 2026
| $ | $ |
|---|---|
| Revenue | 2 400 000 |
| Opening inventory | 180 000 |
| Purchases | 1 600 000 |
| Closing inventory | (220 000) |
| Cost of sales | (1 560 000) |
| Gross profit | 840 000 |
| Operating expenses | (480 000) |
| Profit from operations | 360 000 |
| Finance costs (8% debentures) | (40 000) |
| Profit before tax | 320 000 |
| Tax | (80 000) |
| Profit for the year | 240 000 |
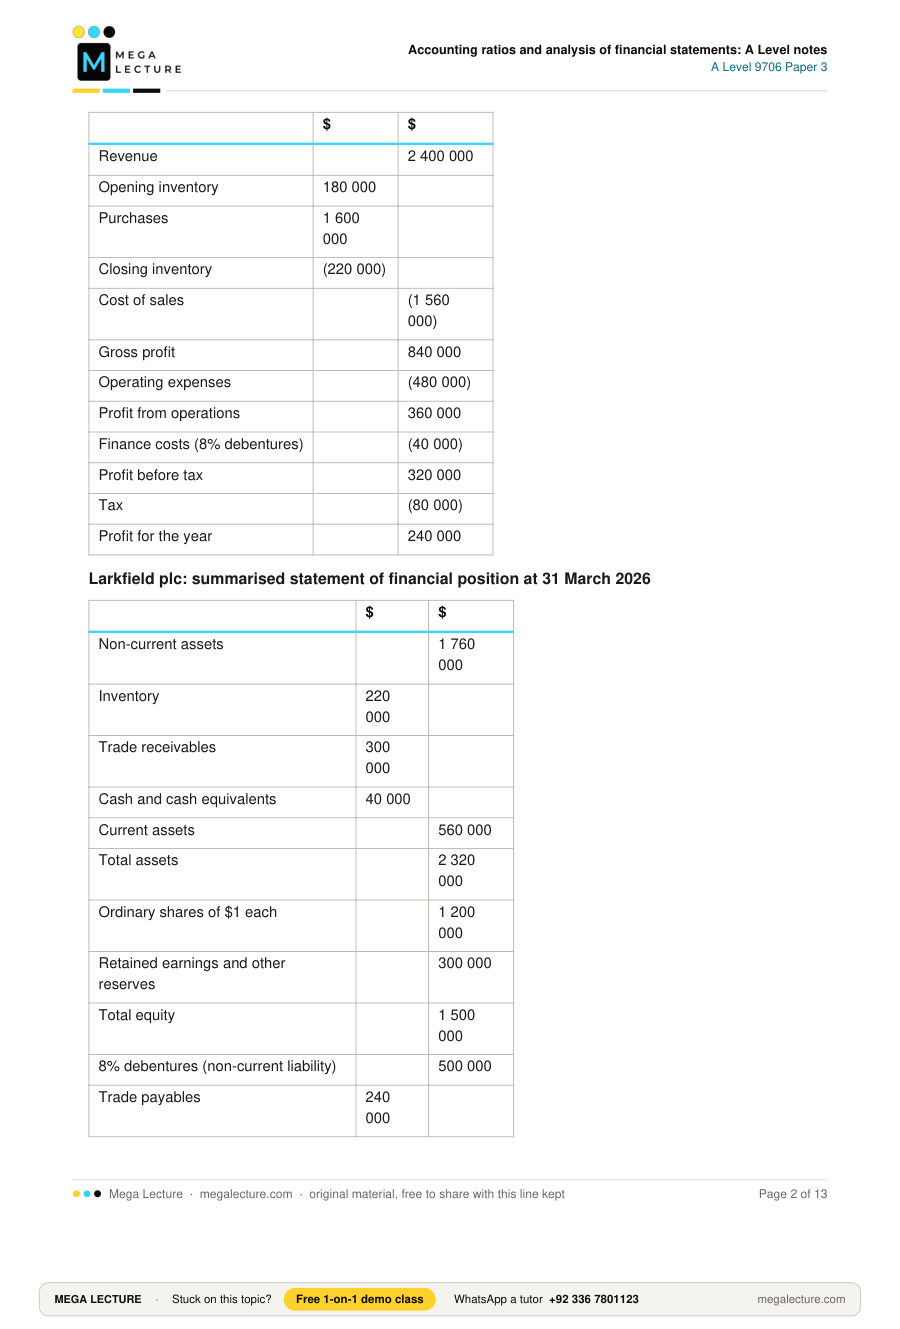
Larkfield plc: summarised statement of financial position at 31 March 2026
| $ | $ |
|---|---|
| Non-current assets | 1 760 000 |
| Inventory | 220 000 |
| Trade receivables | 300 000 |
| Cash and cash equivalents | 40 000 |
| Current assets | 560 000 |
| Total assets | 2 320 000 |
| Ordinary shares of $1 each | 1 200 000 |
| Retained earnings and other reserves | 300 000 |
| Total equity | 1 500 000 |
| 8% debentures (non-current liability) | 500 000 |
| Trade payables | 240 000 |
| Tax payable | 80 000 |
| Current liabilities | 320 000 |
| Total equity and liabilities | 2 320 000 |
Additional information: an ordinary dividend of 8 cents per share was paid during the year. The market price of one ordinary share at 31 March 2026 was $2.40. Larkfield has no preference shares.
2. Profitability ratios
Profitability ratios measure how well the business turns revenue and capital into profit.
2.1 Gross margin and mark-up
Gross margin = (gross profit ÷ revenue) × 100
Mark-up = (gross profit ÷ cost of sales) × 100
Gross margin shows how many cents of gross profit are earned from each dollar of revenue. Mark-up shows the percentage added to cost to set the selling price. They describe the same profit from two angles, so a mark-up of 50% is the same as a gross margin of 33⅓%.
Gross margin changes when selling prices change, when the cost of buying or making goods changes, or when the sales mix changes towards goods with higher or lower margins. A falling gross margin may be caused by price cutting to win sales, higher supplier prices that have not been passed on, or theft and wastage of inventory.
2.2 Profit margin
Profit margin = (profit from operations ÷ revenue) × 100
This shows how much of each dollar of revenue is left after both cost of sales and operating expenses. Comparing it with gross margin isolates the effect of expenses. If gross margin is steady but profit margin falls, operating expenses (for example wages, rent, distribution costs) have risen faster than revenue.
2.3 Return on capital employed (ROCE)
Return on capital employed (ROCE) = (profit from operations ÷ capital employed) × 100
Capital employed = total equity + non-current liabilities (equivalently, total assets − current liabilities)
ROCE is the key measure of overall performance. It shows the profit generated by all the long-term finance in the business, whoever provided it. Profit before interest is used because the capital includes loans, so the return to lenders must still be inside the profit figure. ROCE can be compared with bank deposit rates: if it is lower, owners might do better by investing elsewhere, ignoring risk.
Some textbooks use the average of opening and closing capital employed. Use closing capital employed unless the question gives opening figures and asks for an average.
2.4 Asset turnover
Non-current asset turnover = revenue ÷ non-current assets (net book value)
This shows how much revenue is generated by each dollar of non-current assets. A fall may mean new assets have been bought that are not yet producing revenue. A useful link is:
ROCE = profit margin × (revenue ÷ capital employed)
So ROCE can be raised either by earning more profit on each sale or by generating more sales from the same capital.
Worked example: profitability of Larkfield plc
Gross margin = 840 000 ÷ 2 400 000 × 100 = 35.0%
Mark-up = 840 000 ÷ 1 560 000 × 100 = 53.8%
Profit margin = 360 000 ÷ 2 400 000 × 100 = 15.0%
Capital employed = 1 500 000 + 500 000 = $2 000 000 (check: 2 320 000 − 320 000 = 2 000 000)
ROCE = 360 000 ÷ 2 000 000 × 100 = 18.0%
Non-current asset turnover = 2 400 000 ÷ 1 760 000 = 1.36 times
Check of the link: revenue ÷ capital employed = 2 400 000 ÷ 2 000 000 = 1.2, and 15% × 1.2 = 18%, which agrees with ROCE.
Comment: operating expenses take 20 cents of every dollar of revenue (35% − 15%). An 18% return is well above typical bank deposit rates, but it should be compared with similar companies before calling it good.
3. Liquidity ratios
Liquidity is the ability to pay debts as they fall due. A profitable business can still fail if it runs out of cash, so liquidity is analysed separately from profit.
3.1 Current ratio
Current ratio = current assets ÷ current liabilities (expressed as x : 1)
This compares all short-term assets with all short-term debts. A ratio above 1 : 1 means current assets cover current liabilities. A traditional guide is between 1.5 : 1 and 2 : 1, but the right level depends on the industry: a supermarket that sells for cash and pays suppliers later can run safely below 1 : 1.
A very high current ratio is not necessarily good. It may mean too much money is tied up in idle inventory, slow-paying customers or cash that could be invested.
3.2 Liquid (acid test) ratio
Liquid (acid test) ratio = (current assets − inventory) ÷ current liabilities (expressed as x : 1)
Inventory is removed because it is the least liquid current asset: it must first be sold, often on credit, and then the customer must pay. The acid test therefore asks whether the business could pay its current liabilities without relying on selling inventory. A guide figure is about 1 : 1. A ratio well below this suggests the business may struggle to pay suppliers and could need an overdraft.
Worked example: liquidity of Larkfield plc
Current ratio = 560 000 ÷ 320 000 = 1.75 : 1
Liquid ratio = (560 000 − 220 000) ÷ 320 000 = 340 000 ÷ 320 000 = 1.06 : 1
Comment: both ratios are within the usual guide ranges. However, only $40 000 of current assets is cash. The business depends on collecting its $300 000 of trade receivables to pay its trade payables and tax.
4. Efficiency ratios and the working capital cycle
Efficiency (activity) ratios measure how quickly the business converts inventory into sales and receivables into cash, and how long it takes to pay its own suppliers.
4.1 Inventory turnover
Average inventory = (opening inventory + closing inventory) ÷ 2
Rate of inventory turnover = cost of sales ÷ average inventory (times per year)
Inventory turnover in days = (average inventory ÷ cost of sales) × 365
Cost of sales is used, not revenue, because inventory is valued at cost. A faster turnover (more times a year, fewer days) means less money is tied up and there is less risk of goods becoming obsolete or perishing. A very fast turnover could, however, mean inventory levels are so low that the business risks running out and losing sales.
4.2 Trade receivables turnover (collection period)
Trade receivables turnover in days = (trade receivables ÷ credit sales) × 365
This is the average time credit customers take to pay. It should be compared with the credit terms the business offers. If terms are 30 days and customers take 45, credit control is weak, cash flow suffers and the risk of irrecoverable debts rises. If credit sales are not given, revenue is used, and you should say so.
4.3 Trade payables turnover (payment period)
Trade payables turnover in days = (trade payables ÷ credit purchases) × 365
This is the average time the business takes to pay its suppliers. Taking longer helps cash flow, because suppliers are in effect providing free finance. But paying too slowly can lose cash discounts, damage the business's credit rating and lead suppliers to refuse further credit or raise prices.
4.4 The working capital cycle
Working capital cycle (cash operating cycle) = inventory days + trade receivables days − trade payables days
The cycle measures the number of days between paying cash to suppliers and receiving cash from customers. During that gap the business must finance its working capital from its own cash or an overdraft. A shorter cycle means less finance is needed. The cycle can be shortened by:
- holding lower inventory, for example by ordering more often or using just-in-time methods
- collecting from customers faster, for example by offering cash discounts for early payment, chasing overdue accounts, or using factoring
- negotiating longer credit terms with suppliers, without damaging the relationship.
Worked example: efficiency of Larkfield plc
Average inventory = (180 000 + 220 000) ÷ 2 = $200 000
Rate of inventory turnover = 1 560 000 ÷ 200 000 = 7.8 times
Inventory days = 200 000 ÷ 1 560 000 × 365 = 46.8, about 47 days
Trade receivables days = 300 000 ÷ 2 400 000 × 365 = 45.6, about 46 days
Trade payables days = 240 000 ÷ 1 600 000 × 365 = 54.75, about 55 days
Working capital cycle = 47 + 46 − 55 = 38 days
Comment: Larkfield pays its suppliers about 9 days after its customers pay it, which helps, but goods still sit in inventory for about 47 days. Reducing inventory days would shorten the cycle and release cash.
5. Gearing
Gearing measures how much of the long-term finance comes from sources that carry a fixed cost, such as debentures, long-term loans and preference shares, compared with total long-term finance.
5.1 Gearing ratio
Gearing ratio = (fixed cost capital ÷ total capital employed) × 100
Fixed cost capital = non-current liabilities (debentures and long-term loans) + preference share capital
As a guide, a ratio above 50% is described as highly geared and below 50% as low geared. Some textbooks use the ratio of fixed cost capital to ordinary shareholders' equity instead; state which you use.
Why gearing matters:
- Interest must be paid whether or not the business makes a profit. A highly geared company is at greater risk if profits fall, and lenders may refuse further loans.
- When profits rise, a highly geared company's ordinary shareholders gain more, because interest stays fixed and all the extra profit belongs to them. When profits fall, they lose more. Gearing magnifies both gains and losses for ordinary shareholders.
- Interest is an allowable expense for tax, so debt can be cheaper than equity, and borrowing does not dilute the control of existing shareholders.
5.2 Interest cover
Interest cover = profit from operations ÷ finance costs (times)
This shows how many times the business could pay its interest out of profit. Lenders prefer a high figure. A low figure, for example below 2 times, means a small fall in profit could leave the business unable to pay interest.
Worked example: gearing of Larkfield plc
Gearing = 500 000 ÷ 2 000 000 × 100 = 25.0%
Interest cover = 360 000 ÷ 40 000 = 9 times
Comment: Larkfield is low geared and covers its interest comfortably. It could probably borrow more if it needed to expand.
6. Investment ratios
Investment ratios are used mainly by shareholders and potential investors in limited companies, especially listed companies whose shares have a market price.
6.1 Earnings per share (EPS)
Earnings per share = profit for the year attributable to ordinary shareholders ÷ number of issued ordinary shares
Profit attributable to ordinary shareholders is profit after tax minus any preference dividends. EPS is usually stated in cents. It allows growth in earnings to be tracked even when the number of shares changes, but it cannot be used to compare companies whose shares have different nominal values.
6.2 Price earnings ratio (P/E)
Price earnings ratio = market price per ordinary share ÷ earnings per share
The P/E ratio shows how many years of current earnings an investor is paying for when buying a share. A high P/E means the market expects earnings to grow, or sees the company as low risk. A low P/E may mean the market expects earnings to fall, or that the share is undervalued.
6.3 Dividend per share, dividend cover and dividend yield
Dividend per share = total ordinary dividend ÷ number of issued ordinary shares
Dividend cover = profit for the year attributable to ordinary shareholders ÷ total ordinary dividend (equivalently, EPS ÷ dividend per share)
Dividend yield = (dividend per share ÷ market price per share) × 100
Dividend cover shows how many times the dividend could have been paid from the year's profit. High cover means most profit is retained for growth and the dividend is safe if profits dip. Cover below 1 means part of the dividend is being paid from past reserves, which cannot continue for long.
Dividend yield is the cash return an investor receives on the current market value of the share, and can be compared with interest rates on savings. It ignores any capital gain from a rise in the share price.
Worked example: investment ratios of Larkfield plc
EPS = 240 000 ÷ 1 200 000 = $0.20, that is 20 cents (no preference shares, so all profit for the year belongs to ordinary shareholders)
P/E = 2.40 ÷ 0.20 = 12
Total ordinary dividend = 1 200 000 × $0.08 = $96 000
Dividend cover = 240 000 ÷ 96 000 = 2.5 times (check: 20 ÷ 8 = 2.5)
Dividend yield = 0.08 ÷ 2.40 × 100 = 3.33%
Comment: Larkfield retains 60% of its profit and pays out 40%. A cover of 2.5 times means the dividend is secure. Investors are paying 12 times current earnings for each share.
7. Interpreting ratios in the exam
7.1 Writing a good comment
Paper 3 questions usually ask you to calculate ratios and then analyse or evaluate. A good comment does three things:
- States the change or comparison with figures, for example "the current ratio has fallen from 2.0 : 1 to 1.7 : 1".
- Gives a likely reason linked to the data, for example "because inventory has increased while cash has fallen".
- States the consequence for the business or for the user named in the question, for example "suppliers may be paid more slowly".
Avoid saying a ratio is "good" or "bad" without a reason. A higher inventory turnover is usually better, but not if it causes shortages.
Exam tip: show every formula and every figure you substitute. Method marks are given even if the final figure is wrong. Give percentages to one or two decimal places, ratios as x : 1 to two decimal places, and days to the nearest whole day unless the question says otherwise.
8. Limitations of ratio analysis
Ratios are useful but must be read with care. Examiners often ask for limitations, so learn several and be ready to apply them to the business in the question.
- Historical data: ratios are based on past results and may not predict the future.
- One date only: the statement of financial position shows a single day. Year-end figures may not be typical, for example in a seasonal business, and can be improved for the day ("window dressing"), such as by delaying purchases or chasing receivables just before the year end.
- Different accounting policies: businesses may use different depreciation methods or inventory valuation methods, so their ratios are not strictly comparable.
- Inflation: figures from different years are in dollars of different value, and non-current assets bought long ago may be shown at historical cost far below their current value, which inflates ROCE.
- Different sizes and activities: comparing a small business with a large one, or businesses in different industries, can mislead.
- Non-financial factors are ignored: staff morale, product quality, customer satisfaction, the economy and the actions of competitors do not appear in the ratios.
- Ratios describe, they do not explain: a ratio shows that something has changed, but further investigation is needed to find out why.
- Lack of detail: published accounts may not split sales between cash and credit, so collection periods can only be estimated.
Quick check
Questions 1 to 7 are short. Questions 8, 9 and 10 are longer practice questions in the style of Paper 3. Calculate to two decimal places where needed.
- State the formula for return on capital employed and explain why profit from operations, rather than profit for the year, is used.
- Explain why inventory is excluded from the liquid (acid test) ratio.
- A business has revenue of $800 000 and gross profit of $200 000. Calculate (a) the gross margin and (b) the mark-up.
- A business has inventory days of 60, trade receivables days of 40 and trade payables days of 45. Calculate its working capital cycle and suggest two ways it could shorten the cycle.
- Explain why a high gearing ratio may concern ordinary shareholders at a time when profits are falling.
- A company has profit for the year of $450 000. Preference dividends of $50 000 were paid. It has 2 000 000 ordinary shares in issue, with a market price of $3.00 each, and paid an ordinary dividend of 12 cents per share. Calculate (a) earnings per share, (b) the price earnings ratio, (c) dividend cover and (d) dividend yield.
- State four limitations of using ratios to assess the performance of a business.
- Morrow Ltd provides the following information.
(a) Calculate for each year: gross margin, profit margin, ROCE, current ratio and liquid ratio.2025 ($) 2026 ($) Revenue 1 000 000 1 250 000 Gross profit 400 000 450 000 Profit from operations 150 000 150 000 Capital employed 1 000 000 1 250 000 Current assets (including inventory) 300 000 340 000 Inventory 120 000 200 000 Current liabilities 150 000 200 000
(b) Evaluate the performance and position of Morrow Ltd in 2026 compared with 2025. - Hessel Traders provides the following information for the year ended 30 June 2026. All sales and purchases are on credit.
(a) Calculate credit purchases for the year.$ Revenue 1 095 000 Cost of sales 730 000 Inventory at 1 July 2025 50 000 Inventory at 30 June 2026 90 000 Trade receivables at 30 June 2026 150 000 Trade payables at 30 June 2026 84 000
(b) Calculate inventory days, trade receivables days and trade payables days.
(c) Calculate the working capital cycle.
(d) Hessel offers customers 30 days' credit. Comment on your results. - Penrose plc has 4 000 000 ordinary shares of $1 each, reserves of $2 000 000 and $2 000 000 of 6% debentures. It needs $2 000 000 to expand and expects profit from operations of $1 500 000 a year after the expansion. Tax is 25% of profit before tax. The directors are considering two options:
Option A: issue $2 000 000 of 10% debentures.
Option B: issue 1 000 000 ordinary shares at $2.00 each.
(a) Calculate the gearing ratio before the expansion and under each option.
(b) Calculate interest cover under each option.
(c) Calculate earnings per share under each option.
(d) Advise the directors which option to choose.
1. ROCE = (profit from operations ÷ capital employed) × 100, where capital employed = total equity + non-current liabilities. Capital employed includes long-term loans and debentures as well as equity. The return on that capital must therefore be measured before the interest paid to lenders and before tax, so that profit and capital relate to the same providers of finance. Using profit for the year would understate the return on the capital provided by lenders.
2. Inventory is the least liquid current asset. It has to be sold before it becomes cash or a receivable, sales may be slow, some inventory may be obsolete or damaged, and a quick sale may only be possible at a reduced price. The liquid ratio therefore tests whether the business can meet its current liabilities from assets that are cash or close to cash.
3. (a) Gross margin = 200 000 ÷ 800 000 × 100 = 25.00%.
(b) Cost of sales = 800 000 − 200 000 = $600 000. Mark-up = 200 000 ÷ 600 000 × 100 = 33.33%.
4. Working capital cycle = 60 + 40 − 45 = 55 days. Ways to shorten it (any two): reduce inventory levels by ordering smaller quantities more often or using just-in-time; offer cash discounts for prompt payment; tighten credit control by chasing overdue customers or reducing credit terms; use factoring of trade receivables; negotiate longer credit terms with suppliers.
5. In a highly geared company a large part of capital is debt with a fixed interest charge. When profits fall, the interest still has to be paid in full, so the profit left for ordinary shareholders falls by a larger percentage than profit from operations. Dividends may be cut or stopped. If profit falls below the interest charge, the company may be unable to pay interest, lenders could take action under the loan terms, and in the worst case the company could fail, leaving shareholders, who are paid last, with nothing. Lenders may also refuse further loans.
6. Profit attributable to ordinary shareholders = 450 000 − 50 000 = $400 000.
(a) EPS = 400 000 ÷ 2 000 000 = $0.20 = 20 cents.
(b) P/E = 3.00 ÷ 0.20 = 15.
(c) Total ordinary dividend = 2 000 000 × 0.12 = $240 000. Dividend cover = 400 000 ÷ 240 000 = 1.67 times (check: 20 ÷ 12 = 1.67).
(d) Dividend yield = 0.12 ÷ 3.00 × 100 = 4.00%.
7. Any four, for example: ratios use historical data and may not show the future; the statement of financial position shows one date and may not be typical or may be window dressed; businesses may use different accounting policies, such as depreciation or inventory valuation methods, so comparisons are unreliable; inflation distorts comparisons over time and historical cost asset values can overstate ROCE; non-financial factors such as staff, quality and the economy are ignored; ratios show what has changed but not why.
8. (a)
| Ratio | 2025 | 2026 |
|---|---|---|
| Gross margin | 400 000 ÷ 1 000 000 × 100 = 40.00% | 450 000 ÷ 1 250 000 × 100 = 36.00% |
| Profit margin | 150 000 ÷ 1 000 000 × 100 = 15.00% | 150 000 ÷ 1 250 000 × 100 = 12.00% |
| ROCE | 150 000 ÷ 1 000 000 × 100 = 15.00% | 150 000 ÷ 1 250 000 × 100 = 12.00% |
| Current ratio | 300 000 ÷ 150 000 = 2.00 : 1 | 340 000 ÷ 200 000 = 1.70 : 1 |
| Liquid ratio | (300 000 − 120 000) ÷ 150 000 = 1.20 : 1 | (340 000 − 200 000) ÷ 200 000 = 0.70 : 1 |
(b) Revenue grew by 25%, but gross margin fell from 40% to 36%. Morrow may have cut prices to win the extra sales, or its purchase costs rose without being passed on. Profit from operations stayed at $150 000, so the extra revenue added no profit: profit margin fell from 15% to 12%. Since gross profit rose by $50 000 and profit from operations did not change, operating expenses also rose by $50 000.
ROCE fell from 15% to 12%. An extra $250 000 of capital has been invested with no increase in profit. This may be because new assets were bought late in the year and have not yet produced a full year's return, which would be a reason for optimism next year.
The current ratio is still acceptable at 1.70 : 1, but the liquid ratio has fallen sharply from 1.20 : 1 to 0.70 : 1. Inventory has risen by $80 000 (67%), much faster than revenue, so cash is tied up in goods, and liquid assets cover only 70 cents of each dollar of current liabilities. Morrow may have difficulty paying suppliers on time and may need an overdraft.
Overall, Morrow has grown but has become less profitable and less liquid. Management should review pricing and expenses and reduce inventory. A fair judgement would also need industry averages and information on why capital employed increased.
9. (a) Cost of sales = opening inventory + purchases − closing inventory, so purchases = 730 000 + 90 000 − 50 000 = $770 000.
(b) Average inventory = (50 000 + 90 000) ÷ 2 = $70 000. Inventory days = 70 000 ÷ 730 000 × 365 = 35 days.
Trade receivables days = 150 000 ÷ 1 095 000 × 365 = 50 days.
Trade payables days = 84 000 ÷ 770 000 × 365 = 39.8, about 40 days.
(c) Working capital cycle = 35 + 50 − 40 = 45 days.
(d) Customers take 50 days on average against terms of 30 days, so credit control is weak: about 20 days' worth of sales, roughly $60 000 (1 095 000 ÷ 365 × 20), is tied up beyond the agreed terms, and the risk of irrecoverable debts rises. Hessel pays suppliers in 40 days, faster than it collects, so it must finance a 45-day gap. Closing inventory is 80% higher than opening inventory, which may be planned (for example to meet expected sales) or may mean slow-moving goods. Hessel should chase overdue customers, consider cash discounts for early payment, and review inventory levels.
10. (a) Before: capital employed = 4 000 000 + 2 000 000 + 2 000 000 = $8 000 000. Gearing = 2 000 000 ÷ 8 000 000 × 100 = 25.00%.
Option A: fixed cost capital = 2 000 000 + 2 000 000 = $4 000 000; capital employed = $10 000 000. Gearing = 4 000 000 ÷ 10 000 000 × 100 = 40.00%.
Option B: fixed cost capital stays $2 000 000; capital employed = $10 000 000 (share capital rises by $1 000 000 and share premium by $1 000 000). Gearing = 2 000 000 ÷ 10 000 000 × 100 = 20.00%.
(b) Existing interest = 6% × 2 000 000 = $120 000.
Option A: extra interest = 10% × 2 000 000 = $200 000; total $320 000. Interest cover = 1 500 000 ÷ 320 000 = 4.69 times.
Option B: interest $120 000. Interest cover = 1 500 000 ÷ 120 000 = 12.50 times.
| (c) | Option A ($) | Option B ($) |
|---|---|---|
| Profit from operations | 1 500 000 | 1 500 000 |
| Finance costs | (320 000) | (120 000) |
| Profit before tax | 1 180 000 | 1 380 000 |
| Tax at 25% | (295 000) | (345 000) |
| Profit for the year | 885 000 | 1 035 000 |
| Number of ordinary shares | 4 000 000 | 5 000 000 |
| EPS | 22.13 cents | 20.70 cents |
(d) Option A gives the higher EPS (22.13 cents against 20.70 cents) and does not dilute the control of existing shareholders, because no new shares are issued. Interest is also tax deductible. However, gearing rises to 40%, still below 50% but much higher than now, and interest cover falls to 4.69 times. If the expected profit is not achieved, the fixed interest of $320 000 must still be paid, so shareholders' earnings would fall sharply. Option B keeps gearing low (20%) and interest cover very safe, but spreads profit over more shares and may change who controls the company if the new shares go to outsiders. Debentures must also be repaid on maturity, while share capital need not.
Recommendation: if the directors are confident the $1 500 000 profit forecast is reliable, Option A gives a better return to existing shareholders at an acceptable level of risk. If the forecast is uncertain, Option B is safer. Either conclusion earns credit if it is supported by the figures.
