
A Level · Business · The Boston Matrix and the product life cycle: notes
The Boston Matrix and the product life cycle: notes
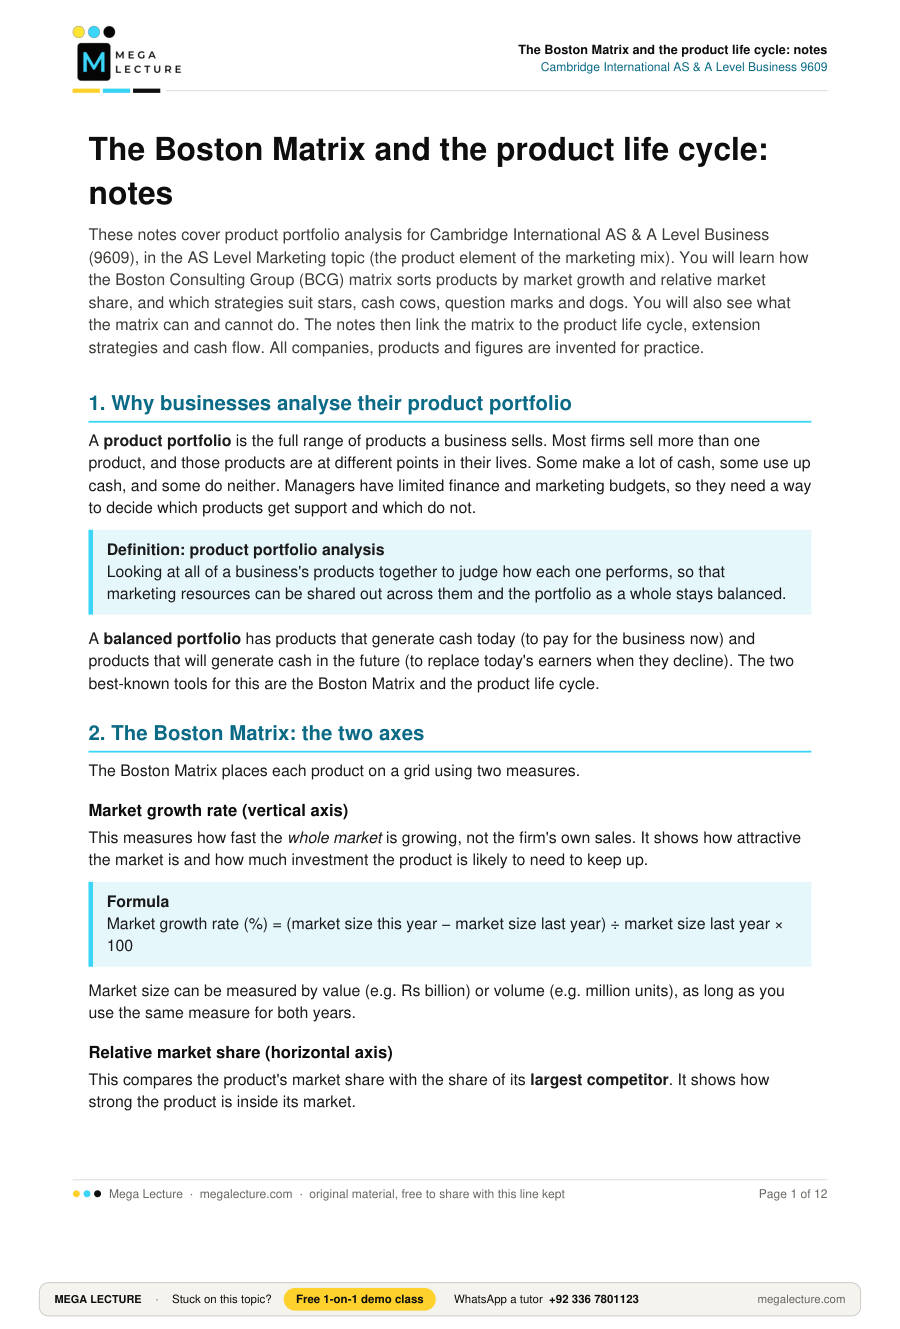
Opens inside this page. Prefer your own PDF app? Open the PDF.
Check yourself
5 quick questions on A Level Business
Tap an answer to see if you are right, and why. Free, no sign-up.
Start the free test3 of 5 students found these notes useful
Was this note useful?
Full text of The Boston Matrix and the product life cycle: notes
These notes cover product portfolio analysis for Cambridge International AS & A Level Business (9609), in the AS Level Marketing topic (the product element of the marketing mix). You will learn how the Boston Consulting Group (BCG) matrix sorts products by market growth and relative market share, and which strategies suit stars, cash cows, question marks and dogs. You will also see what the matrix can and cannot do. The notes then link the matrix to the product life cycle, extension strategies and cash flow. All companies, products and figures are invented for practice.
1. Why businesses analyse their product portfolio
A product portfolio is the full range of products a business sells. Most firms sell more than one product, and those products are at different points in their lives. Some make a lot of cash, some use up cash, and some do neither. Managers have limited finance and marketing budgets, so they need a way to decide which products get support and which do not.
Definition: product portfolio analysis
Looking at all of a business's products together to judge how each one performs, so that marketing resources can be shared out across them and the portfolio as a whole stays balanced.
A balanced portfolio has products that generate cash today (to pay for the business now) and products that will generate cash in the future (to replace today's earners when they decline). The two best-known tools for this are the Boston Matrix and the product life cycle.
2. The Boston Matrix: the two axes
The Boston Matrix places each product on a grid using two measures.
Market growth rate (vertical axis)
This measures how fast the whole market is growing, not the firm's own sales. It shows how attractive the market is and how much investment the product is likely to need to keep up.
Formula
Market growth rate (%) = (market size this year − market size last year) ÷ market size last year × 100
Market size can be measured by value (e.g. Rs billion) or volume (e.g. million units), as long as you use the same measure for both years.
Relative market share (horizontal axis)
This compares the product's market share with the share of its largest competitor. It shows how strong the product is inside its market.
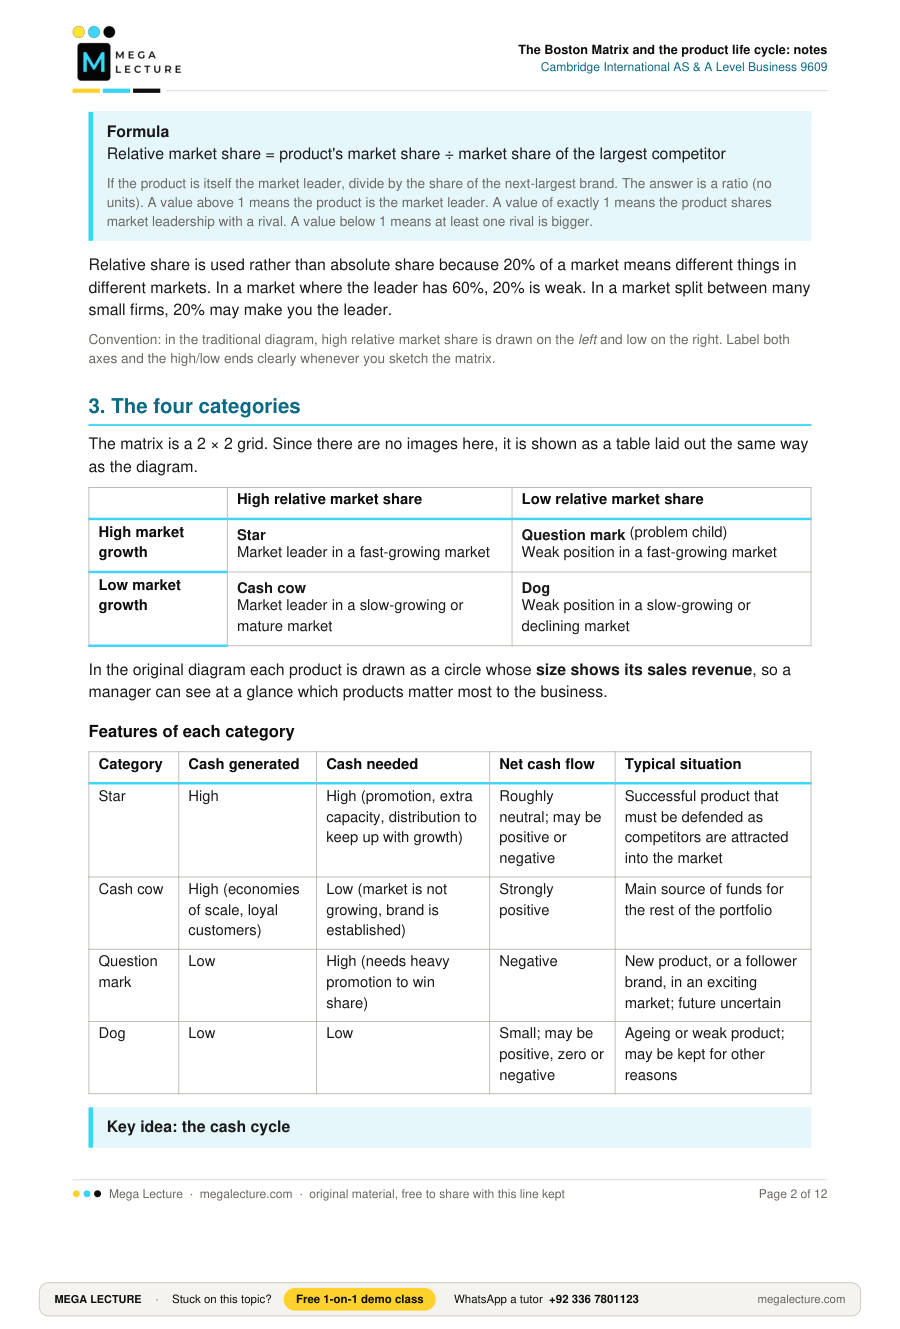
Formula
Relative market share = product's market share ÷ market share of the largest competitor
If the product is itself the market leader, divide by the share of the next-largest brand. The answer is a ratio (no units). A value above 1 means the product is the market leader. A value of exactly 1 means the product shares market leadership with a rival. A value below 1 means at least one rival is bigger.
Relative share is used rather than absolute share because 20% of a market means different things in different markets. In a market where the leader has 60%, 20% is weak. In a market split between many small firms, 20% may make you the leader.
Convention: in the traditional diagram, high relative market share is drawn on the left and low on the right. Label both axes and the high/low ends clearly whenever you sketch the matrix.
3. The four categories
The matrix is a 2 × 2 grid. Since there are no images here, it is shown as a table laid out the same way as the diagram.
| High relative market share | Low relative market share | |
|---|---|---|
| High market growth | Star Market leader in a fast-growing market | Question mark (problem child) Weak position in a fast-growing market |
| Low market growth | Cash cow Market leader in a slow-growing or mature market | Dog Weak position in a slow-growing or declining market |
In the original diagram each product is drawn as a circle whose size shows its sales revenue, so a manager can see at a glance which products matter most to the business.
Features of each category
| Category | Cash generated | Cash needed | Net cash flow | Typical situation |
|---|---|---|---|---|
| Star | High | High (promotion, extra capacity, distribution to keep up with growth) | Roughly neutral; may be positive or negative | Successful product that must be defended as competitors are attracted into the market |
| Cash cow | High (economies of scale, loyal customers) | Low (market is not growing, brand is established) | Strongly positive | Main source of funds for the rest of the portfolio |
| Question mark | Low | High (needs heavy promotion to win share) | Negative | New product, or a follower brand, in an exciting market; future uncertain |
| Dog | Low | Low | Small; may be positive, zero or negative | Ageing or weak product; may be kept for other reasons |
Key idea: the cash cycle
The matrix is really about cash. Cash cows produce surplus cash. That cash should be used to turn the best question marks into stars. When the stars' markets slow down, they become the next cash cows. A business with only cash cows has no future. A business with only question marks and stars may run out of cash.
4. Strategies for each category
BCG suggested four broad strategies. Remember that the category suggests a strategy; it does not decide it.
| Strategy | Meaning | Most often used for | Example actions |
|---|---|---|---|
| Build | Invest to increase market share | Promising question marks | Heavy advertising, price cuts to win customers, wider distribution, product improvements |
| Hold | Invest enough to keep the current share | Stars; strong cash cows | Brand reminders, loyalty schemes, matching competitor offers, small updates |
| Harvest | Cut spending and take as much cash as possible in the short term, accepting that share may fall | Cash cows whose market is starting to decline; weak dogs; weak question marks | Reduce promotion, limit the range of sizes, raise price slightly, no new investment |
| Divest | Withdraw the product by selling it or stopping production, and use the resources elsewhere | Dogs; question marks with little chance of success | Sell the brand to another firm, run down stock, close the production line |
Firms do not always divest dogs. A dog may be worth keeping if it:
- still makes a positive contribution to fixed costs;
- completes a product range that customers expect (a retailer may need to stock it for other products to sell);
- shares production or distribution costs with other products, so dropping it raises their unit costs;
- blocks a competitor from entering, or is being prepared for a relaunch.
5. Worked example: classifying a portfolio
Case: Qasrin Beverages Ltd, Lahore
Qasrin Beverages sells four drinks in Pakistan. The table shows invented data for 2025.
| Product | Market size 2024 (Rs bn) | Market size 2025 (Rs bn) | Qasrin's market share | Share of largest rival |
|---|---|---|---|---|
| Tavlo mango nectar | 20.0 | 20.6 | 30% | 15% |
| Vortiq energy drink | 12.5 | 14.75 | 6% | 24% |
| Kolvra cola | 50.0 | 49.0 | 4% | 40% |
| Limzey sparkling lemon water | 4.0 | 4.6 | 28% | 20% |
For Tavlo and Limzey, Qasrin is the market leader, so the "largest rival" is the next-largest brand.
Step 1: calculate market growth for each product.
- Tavlo: (20.6 − 20.0) ÷ 20.0 × 100 = 0.6 ÷ 20.0 × 100 = 3%
- Vortiq: (14.75 − 12.5) ÷ 12.5 × 100 = 2.25 ÷ 12.5 × 100 = 18%
- Kolvra: (49.0 − 50.0) ÷ 50.0 × 100 = −1.0 ÷ 50.0 × 100 = −2% (the market is shrinking)
- Limzey: (4.6 − 4.0) ÷ 4.0 × 100 = 0.6 ÷ 4.0 × 100 = 15%
Step 2: calculate relative market share.
- Tavlo: 30 ÷ 15 = 2.0
- Vortiq: 6 ÷ 24 = 0.25
- Kolvra: 4 ÷ 40 = 0.1
- Limzey: 28 ÷ 20 = 1.4
Step 3: decide what counts as "high". Qasrin's managers treat market growth above 10% as high. They treat a relative share of 1.0 or more as high, because it means the product leads its market or shares the lead. These cut-off points are a management choice, not a fixed rule.
Step 4: classify and suggest a strategy.
| Product | Growth | Relative share | Category | Possible strategy |
|---|---|---|---|---|
| Tavlo | 3% (low) | 2.0 (high) | Cash cow | Hold; use its cash to fund others |
| Vortiq | 18% (high) | 0.25 (low) | Question mark | Build if Qasrin can realistically catch the leader; otherwise divest |
| Kolvra | −2% (low) | 0.1 (low) | Dog | Harvest or divest |
| Limzey | 15% (high) | 1.4 (high) | Star | Hold (defend its lead as rivals enter) |
Step 5: comment on the balance. Qasrin has one of each type, which looks balanced. However, Tavlo is the only strong cash generator and its market grows at just 3%. If Qasrin spends heavily on both Vortiq and Limzey at the same time, Tavlo may not produce enough cash to fund both. Divesting Kolvra would free up some cash and management time, but Qasrin should first check whether Kolvra shares bottling lines with the other drinks.
6. Uses of the Boston Matrix
- Shows the balance of the portfolio on one simple chart, so gaps are easy to spot (e.g. no stars to replace an ageing cash cow).
- Guides the allocation of marketing budgets and cash: from cash cows towards selected question marks and stars.
- Helps with planning: it prompts managers to think about which products will be the cash cows in five years' time and whether new product development is needed.
- Supports decisions to drop products, freeing resources tied up in dogs.
- Easy to understand and communicate to other managers and to investors.
- If repeated each year, it shows how products move between categories, which can reveal problems early.
7. Limitations of the Boston Matrix
- Only two variables. It ignores profitability, the product's contribution, customer loyalty, the strength of competitors and wider factors such as government policy.
- High market share does not guarantee high profit. A leader may have won share through low prices; a small premium brand may be very profitable.
- Market definition changes the answer. Is Vortiq in the "energy drink market" or the "soft drinks market"? A narrow definition makes a product look stronger.
- Cut-off points are arbitrary. A product with 9% growth and one with 11% growth are almost the same, yet they fall in different boxes.
- It is a snapshot. It shows the position now, not where the product is heading, and data may be out of date.
- It ignores links between products. A dog may support sales of other products or share their costs.
- The labels can become self-fulfilling. If managers call a product a dog and cut its budget, its sales will fall even if it could have recovered.
- Data can be hard or costly to obtain, especially reliable market share figures in markets with many informal sellers, as is common in parts of Pakistan.
Evaluation tip
A strong judgement says the matrix is a useful starting point for discussion but should be used with other information (profit margins, contribution, market research, the business's objectives and the finance available). Always refer back to the case: how reliable are this firm's data, and how linked are its products?
8. The product life cycle
Definition: product life cycle
The stages a product passes through from its launch to its withdrawal from the market, showing how its sales change over time.
The usual diagram plots sales (vertical axis) against time (horizontal axis). The curve starts at zero, rises slowly, then steeply, levels off, and finally falls. Described stage by stage:
| Stage | Sales | Profit | Competition | Typical marketing mix |
|---|---|---|---|---|
| Development | None | None; losses from research, design and testing | Not yet relevant | Market research, prototypes, test marketing |
| Introduction | Low, rising slowly | Usually a loss (high launch costs, low volume) | Few or none | Heavy informative promotion; either a skimming or penetration price; limited distribution |
| Growth | Rising quickly | Becomes positive and rises | Rivals start to enter | Persuasive promotion, wider distribution, possible product improvements |
| Maturity | Highest but growing slowly | Highest, though margins come under pressure | Strong; many rivals | Reminder promotion, competitive pricing, extension strategies, widest distribution |
| Saturation (sometimes shown) | Flat; market is full | Falling as prices are cut | Very strong; weaker firms leave | Price competition, brand loyalty schemes |
| Decline | Falling | Falling; may become a loss | Firms leave the market | Little promotion, price cuts or rises to loyal buyers, fewer outlets; decide whether to withdraw |
The length of each stage varies greatly. A fashion item or a mobile game may pass through all stages in months; a basic food product may stay in maturity for decades. The model describes a typical pattern; it cannot predict when a stage will end.
9. Extension strategies
An extension strategy is an action taken, usually in maturity or early decline, to lengthen the life cycle by stopping sales from falling or by starting a new period of growth. On the diagram it appears as a new upward "bump" in the sales curve just where it would have turned down.
| Extension strategy | Invented example |
|---|---|
| Find new markets (new regions or countries) | A Karachi biscuit maker starts exporting its best-selling biscuit to the Gulf states |
| Find new uses for the product | A cooking oil brand promotes itself as suitable for baking as well as frying |
| Target new customer segments | A sports shoe brand launches a version for older walkers |
| Modify or update the product | A washing powder is relaunched with a new fragrance and a "works in cold water" formula |
| Change the packaging or size | A snack brand adds a Rs 20 small pack for school children |
| Reposition the product on price | A tea brand adds a permanent lower-priced "value" range for price-sensitive households |
| New promotional campaign or distribution channel | Selling through an online grocery app as well as corner shops |
Short-term sales promotions, such as a limited-time "buy two, get one free" offer, usually give only a temporary boost to sales. On their own they are not normally enough to lengthen the life cycle.
Extension strategies cost money and do not always work. A business must compare the cost with the extra contribution expected, and consider whether the money would be better spent developing a new product.
10. Cash flow over the product life cycle
Cash flow and profit follow a different pattern from sales. Cash goes out before sales begin, so a product has negative cash flow in development and usually in introduction. Net cash flow normally turns positive during growth, is highest in maturity (sales are high and launch costs have been paid) and falls in decline.
Worked example: cash flow of a new product
Varnholt Audio, an invented Swedish firm, launches wireless earbuds in Pakistan. Figures are in Rs million.
| Year | Stage | Cash inflow | Cash outflow | Net cash flow | Cumulative net cash flow |
|---|---|---|---|---|---|
| 0 | Development | 0 | 40 | −40 | −40 |
| 1 | Introduction | 30 | 55 | −25 | −65 |
| 2 | Growth | 90 | 80 | +10 | −55 |
| 3 | Growth | 160 | 110 | +50 | −5 |
| 4 | Maturity | 200 | 120 | +80 | +75 |
| 5 | Maturity | 190 | 115 | +75 | +150 |
| 6 | Decline | 120 | 90 | +30 | +180 |
Step 1: net cash flow = cash inflow − cash outflow. Year 1: 30 − 55 = −25. Year 4: 200 − 120 = +80.
Step 2: cumulative = previous cumulative + this year's net cash flow. Year 1: −40 + (−25) = −65. Year 2: −65 + 10 = −55. Year 3: −55 + 50 = −5. Year 4: −5 + 80 = +75.
Step 3: interpret. The product uses Rs 65 million of cash before it starts paying back. The cumulative figure only turns positive during year 4, in maturity. The largest net cash flow (Rs 80 million) comes in maturity. This mirrors the Boston Matrix: a mature product that is also a market leader becomes a cash cow. Varnholt must have enough finance (for example from other products) to survive years 0–3.
11. Linking the Boston Matrix and the product life cycle
The two models fit together, because both are driven by the growth of the market and the product's cash needs.
| Life cycle stage | Likely Boston Matrix category | Cash position |
|---|---|---|
| Introduction | Question mark | Negative |
| Growth | Star (if it wins leadership) or remains a question mark | Around break-even, becoming positive |
| Maturity | Cash cow (if a leader) or dog (if a weak follower) | Strongly positive for leaders |
| Decline | Dog, or a cash cow being harvested | Falling |
So a balanced portfolio means having products at different stages of the life cycle. When one product enters decline, another should be in growth ready to become the next cash cow. Launches should be timed so that the positive cash from mature products pays for the negative cash of new ones.
The link is not exact. The life cycle tracks one product's own sales, while the matrix uses the whole market's growth and relative share. A product in the growth stage of its own life may still sit in a mature, low-growth market, and a weak new brand launched into a mature market would be a dog from the start.
Common exam mistakes
- Using the firm's own sales growth for the vertical axis. Use the growth of the whole market.
- Using absolute market share for the horizontal axis. Divide the product's share by the share of its largest competitor.
- Saying the category decides the strategy ("it is a dog, so it must be dropped"). The category only suggests a strategy; justify your choice from the case (contribution, links with other products, objectives, finance).
- Treating a Boston category and a life cycle stage as the same thing. The life cycle follows the product's own sales over time; the matrix uses market growth and relative share. A weak new brand in a mature market is a dog, not a question mark.
- Confusing profit with cash flow. A product can make a profit but still have negative cash flow (e.g. while building stock or giving credit). The matrix is about cash.
- Listing extension strategies without context. Choose strategies that fit the product, its customers and the firm's budget, and explain how each would raise sales.
Key terms
| Term | Definition |
|---|---|
| Product portfolio | The complete range of products sold by a business. |
| Boston Matrix | A portfolio analysis tool that classifies products by market growth rate and relative market share into stars, cash cows, question marks and dogs. |
| Market growth rate | The percentage change in the total size of a market over a period. |
| Relative market share | A product's market share divided by the market share of its largest competitor. |
| Star | A product with high relative market share in a high-growth market. |
| Cash cow | A product with high relative market share in a low-growth market; generates surplus cash. |
| Question mark (problem child) | A product with low relative market share in a high-growth market; uses more cash than it earns. |
| Dog | A product with low relative market share in a low-growth market. |
| Build | Investing in a product to increase its market share. |
| Hold | Spending enough to keep a product's current market share. |
| Harvest | Reducing spending on a product to maximise short-term cash, accepting falling share. |
| Divest | Selling or withdrawing a product so resources can be used elsewhere. |
| Product life cycle | The stages a product passes through from launch to withdrawal, showing how its sales change over time. |
| Extension strategy | An action to lengthen a product's life cycle, usually taken in maturity or decline. |
| Balanced portfolio | A range of products at different stages and positions, so that cash generators fund future earners. |
Quick check
- Define the term "relative market share". [2]
- State the two variables used in the Boston Matrix. [2]
- Identify two features of a product in the introduction stage of its life cycle. [2]
- A market was worth Rs 8.0 billion in 2024 and Rs 8.4 billion in 2025. Calculate the market growth rate. [2]
- Drevan Paints has 12% of the Pakistani exterior paint market. The market leader has 30%. Calculate Drevan's relative market share. [2]
- Using your answers to questions 4 and 5 and a 10% growth cut-off, identify the Boston Matrix category of Drevan's exterior paint and state one suitable strategy. [2]
- Explain why a cash cow usually produces a larger cash surplus (net cash flow) than a star. [3]
- Explain two extension strategies a Pakistani toothpaste brand in maturity could use. [4]
- Explain why net cash flow for a product is usually negative in the introduction stage even when sales are growing. [3]
- Look back at the Qasrin Beverages case in section 5. Kolvra cola is classed as a dog. Analyse why Qasrin might decide to keep Kolvra. [8]
- Quenmar Electronics (invented) has two cash cows in markets growing at 1% a year, one dog and no stars or question marks. Analyse the risks of this portfolio for Quenmar. [8]
- Evaluate the usefulness of the Boston Matrix to a food manufacturer deciding how to divide its marketing budget between its products. [12]
1. Full definition: a product's market share divided by the market share of its largest competitor [2]. Partial answer, e.g. "its share compared with competitors" [1].
Note: a value above 1 shows the product is the market leader; exactly 1 means it shares the lead; below 1 means a rival is bigger.
2. Market growth rate [1]; relative market share [1].
3. Any two: low sales; sales growing slowly; losses / negative cash flow; high promotional spending; few competitors; limited distribution. [1 each]
4. (8.4 − 8.0) ÷ 8.0 × 100 [1] = 0.4 ÷ 8.0 × 100 = 5% [1].
5. 12 ÷ 30 [1] = 0.4 [1].
6. Growth 5% (low) and relative share 0.4 (low, below 1), so it is a dog [1]. Strategy: harvest (cut spending, take remaining cash) or divest (sell or withdraw) [1]. Accept "hold" only if justified, e.g. it completes the paint range.
7. Both have high relative market share, so both can generate high cash inflows, helped by economies of scale [1]. A star is in a fast-growing market, so it needs heavy spending on promotion, capacity and distribution to keep its share as rivals enter; much of its cash is used up [1]. A cash cow's market is slow-growing and its brand is established, so little new investment is needed; cash needed is low, leaving a larger surplus [1].
8. Two strategies explained, 2 marks each (identify + explain in context). For example: new product variant such as a herbal or whitening version [1], which attracts customers who switched to rival specialist brands and so raises sales again [1]; new packaging/size such as a small low-price sachet [1], which makes the brand affordable to low-income or rural buyers who do not buy full tubes, opening a new segment [1]. Also accept new markets (export), new promotion campaigns, a lasting price repositioning.
9. Cash outflows are high: launch advertising, stocking distributors and paying for production [1]. Sales volume is still low, so cash inflow is small [1]. Also, customers or retailers may be given credit, so cash from sales arrives later than cash going out, meaning outflows exceed inflows [1].
10. Possible points: Kolvra may still make a positive contribution to fixed costs, so dropping it would reduce total profit unless those fixed costs can be cut; it may share bottling lines or delivery routes with Tavlo and Limzey, so removing it would raise their unit costs; shops may expect Qasrin to supply a full range including a cola, so dropping it could reduce orders for its star and cash cow; it keeps Qasrin present in the large Rs 49 billion cola market, which it could build on later with a relaunch.
Levels:
- Level 3 (6–8): developed analysis of two or more reasons, each a chain of reasoning showing the effect on Qasrin, applied to the case.
- Level 2 (3–5): some analysis of at least one reason, or reasons with limited use of the case.
- Level 1 (1–2): knowledge only, e.g. reasons listed without explanation.
Example of Level 3 reasoning: "Kolvra may be filled on the same bottling line as Tavlo and Limzey. The fixed costs of that line, such as maintenance and depreciation, are spread across all three drinks. If Kolvra is dropped, the same fixed costs are shared over fewer bottles, so the unit cost of Tavlo and Limzey rises. Qasrin would then have to either raise their prices, risking the leadership that makes Tavlo a cash cow, or accept lower margins, which reduces the cash available to build Vortiq. So keeping Kolvra may protect the rest of the portfolio even though Kolvra itself looks weak."
11. Possible points: both main products are in low-growth markets, so they are probably in maturity and will eventually decline; there are no question marks or stars, so nothing is ready to replace them, leading to falling revenue and cash in future; Quenmar depends heavily on two products, so a new competitor or new technology in either market could cause a large fall in profits; new products take years to develop and pass through loss-making introduction stages, so Quenmar must start spending now while its cash cows can still fund it. Credit a point that the current cash position may be strong, which gives Quenmar the means to fix the problem.
Levels:
- Level 3 (6–8): developed analysis of two or more risks, each a chain of reasoning showing the consequence for Quenmar, applied to its portfolio.
- Level 2 (3–5): some analysis of at least one risk, or limited application to Quenmar.
- Level 1 (1–2): knowledge only, e.g. describing cash cows and dogs.
Example of Level 3 reasoning: "In consumer electronics, technology changes quickly. If a rival launches a new type of product that replaces one of Quenmar's cash cows, sales in that market could fall sharply rather than slowly. Because Quenmar has only two cash cows and no stars, losing one could cut its cash inflow by around half. It would then have less money to develop new products at exactly the time it needs them, so the business could enter a cycle of falling sales and falling investment."
12. Knowledge and application: explain the four categories and the build/hold/harvest/divest strategies, applied to a food manufacturer (e.g. a mature cooking-oil cash cow funding a new frozen-food question mark). Analysis (usefulness): gives a clear picture of which products need cash and which provide it; helps move budget from cash cows to promising question marks; highlights dogs that waste resources; easy to share with managers. Analysis (limitations): uses only growth and share, not profit or contribution; food markets are hard to define (snacks, or healthy snacks?); reliable share data may be costly, especially with many informal sellers; cut-offs are arbitrary; ignores links such as shared factories and range completeness; a snapshot that may be out of date. Evaluation: a supported judgement on how useful the matrix is for this decision, and what it depends on.
Levels:
- Level 4 (9–12): balanced analysis leading to a supported judgement that is applied to the food manufacturer and its budget decision.
- Level 3 (5–8): balanced analysis of uses and limitations with some application; judgement missing or not supported.
- Level 2 (3–4): some application to a food manufacturer; analysis limited or one-sided.
- Level 1 (1–2): knowledge of the matrix only.
Example of a Level 4 conclusion: "For a food manufacturer, the Boston Matrix is a useful first screen for dividing the marketing budget, because it shows quickly which products, such as a mature cooking oil, provide cash and which, such as a new frozen-food range, need it. However, its usefulness depends on the quality of the data. The frozen-food market is hard to define and share figures may be unreliable where many informal sellers operate, so the category could be wrong. If the products also share factories and delivery vans, cutting a 'dog' could raise costs for the others. The matrix should therefore guide the first draft of the budget, but the final split should rest on each product's contribution, consumer research on demand for frozen food and the firm's objectives. It is most useful when the firm has reliable market data and its products are not closely linked."
