
A Level · Economics 9708 · The macroeconomy: AS notes
The macroeconomy: AS notes
Opens inside this page. Prefer your own PDF app? Open the PDF.
Check yourself
5 quick questions on A Level Economics
Tap an answer to see if you are right, and why. Free, no sign-up.
Start the free test14 of 15 students found these notes useful
Was this note useful?
Full text of The macroeconomy: AS notes
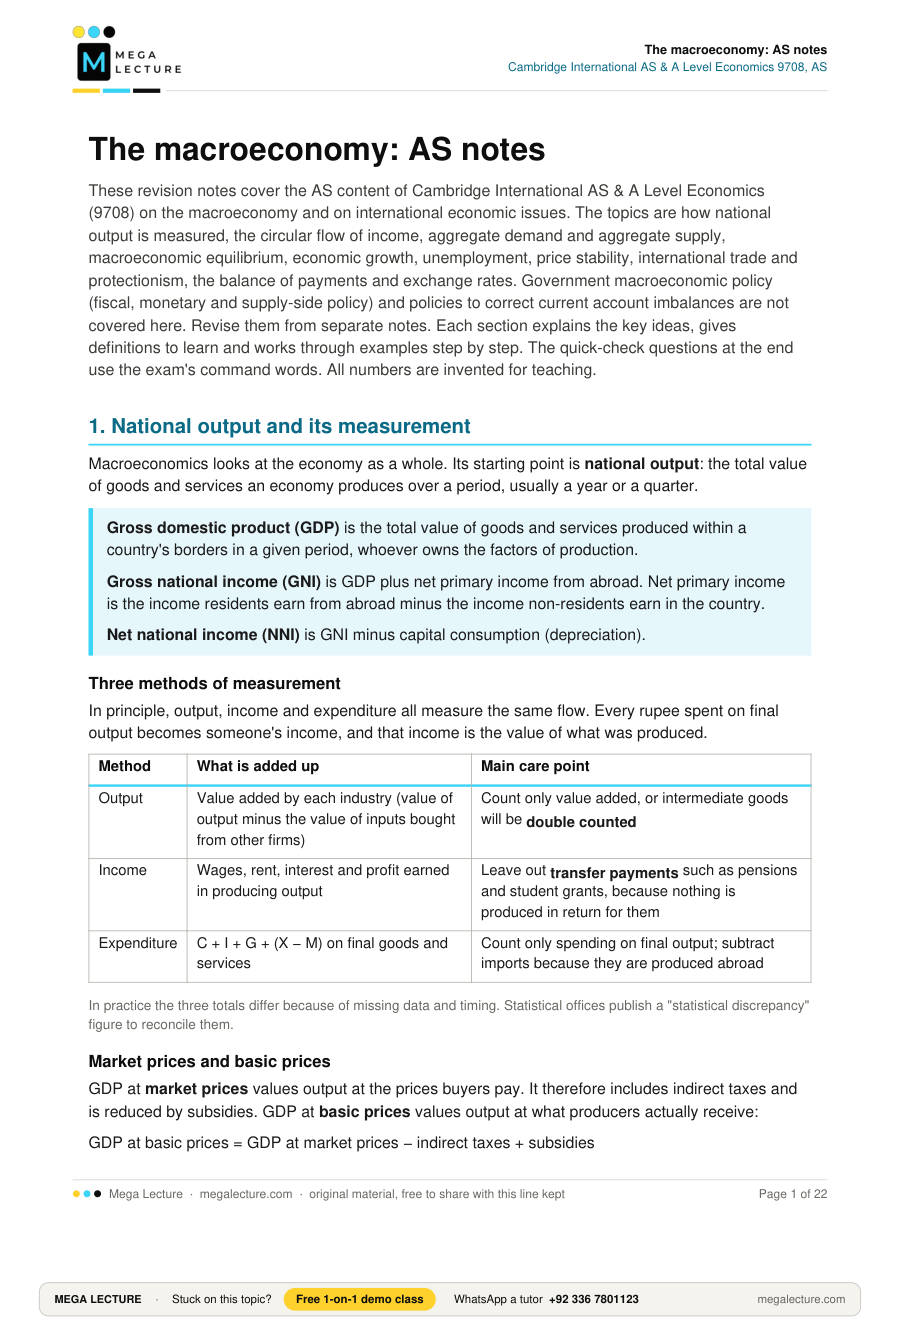
These revision notes cover the AS content of Cambridge International AS & A Level Economics (9708) on the macroeconomy and on international economic issues. The topics are how national output is measured, the circular flow of income, aggregate demand and aggregate supply, macroeconomic equilibrium, economic growth, unemployment, price stability, international trade and protectionism, the balance of payments and exchange rates. Government macroeconomic policy (fiscal, monetary and supply-side policy) and policies to correct current account imbalances are not covered here. Revise them from separate notes. Each section explains the key ideas, gives definitions to learn and works through examples step by step. The quick-check questions at the end use the exam's command words. All numbers are invented for teaching.
1. National output and its measurement
Macroeconomics looks at the economy as a whole. Its starting point is national output: the total value of goods and services an economy produces over a period, usually a year or a quarter.
Gross domestic product (GDP) is the total value of goods and services produced within a country's borders in a given period, whoever owns the factors of production.
Gross national income (GNI) is GDP plus net primary income from abroad. Net primary income is the income residents earn from abroad minus the income non-residents earn in the country.
Net national income (NNI) is GNI minus capital consumption (depreciation).
Three methods of measurement
In principle, output, income and expenditure all measure the same flow. Every rupee spent on final output becomes someone's income, and that income is the value of what was produced.
| Method | What is added up | Main care point |
|---|---|---|
| Output | Value added by each industry (value of output minus the value of inputs bought from other firms) | Count only value added, or intermediate goods will be double counted |
| Income | Wages, rent, interest and profit earned in producing output | Leave out transfer payments such as pensions and student grants, because nothing is produced in return for them |
| Expenditure | C + I + G + (X − M) on final goods and services | Count only spending on final output; subtract imports because they are produced abroad |
In practice the three totals differ because of missing data and timing. Statistical offices publish a "statistical discrepancy" figure to reconcile them.
Market prices and basic prices
GDP at market prices values output at the prices buyers pay. It therefore includes indirect taxes and is reduced by subsidies. GDP at basic prices values output at what producers actually receive:
GDP at basic prices = GDP at market prices − indirect taxes + subsidies
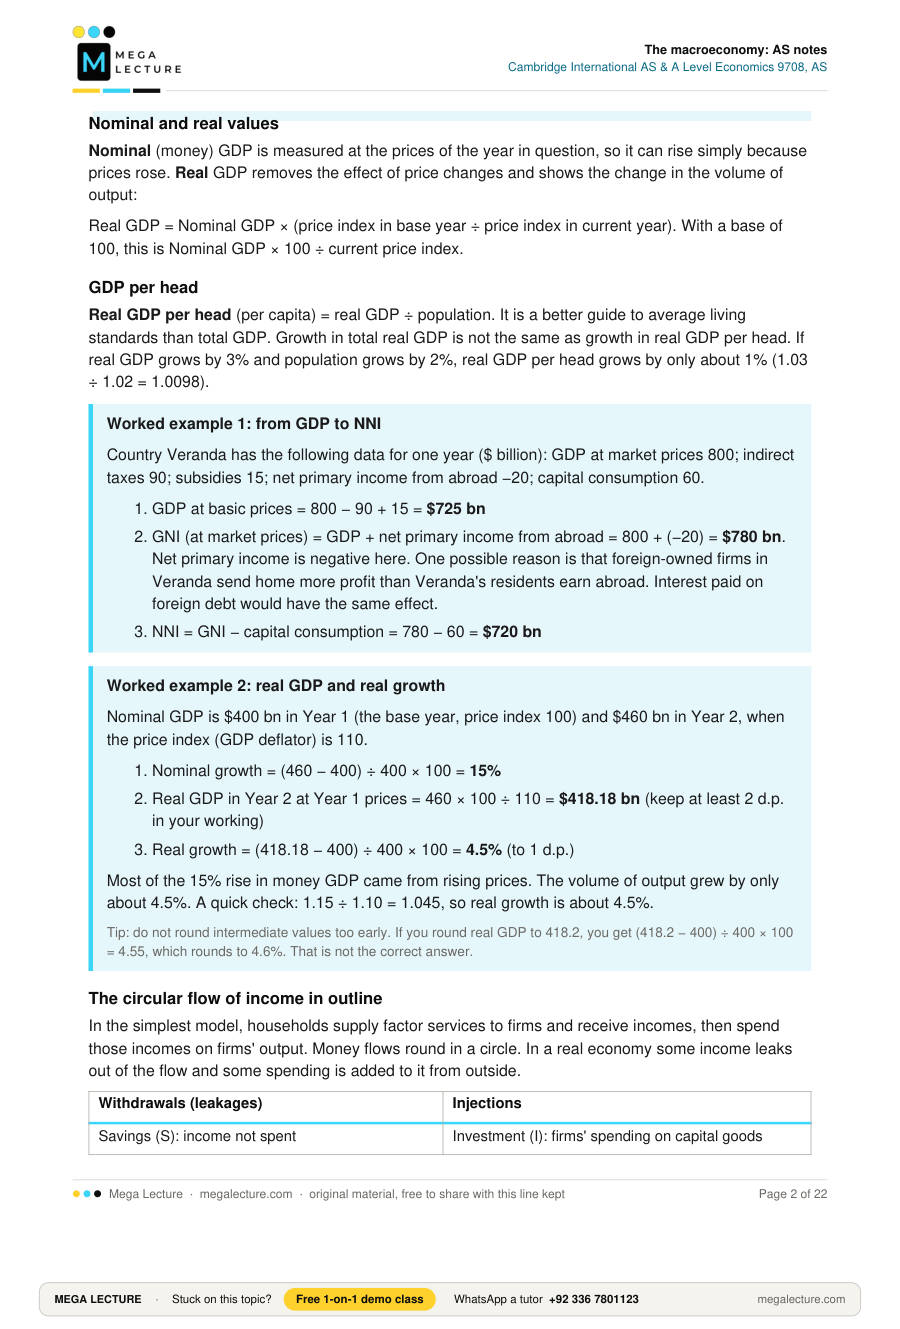
Nominal and real values
Nominal (money) GDP is measured at the prices of the year in question, so it can rise simply because prices rose. Real GDP removes the effect of price changes and shows the change in the volume of output:
Real GDP = Nominal GDP × (price index in base year ÷ price index in current year). With a base of 100, this is Nominal GDP × 100 ÷ current price index.
GDP per head
Real GDP per head (per capita) = real GDP ÷ population. It is a better guide to average living standards than total GDP. Growth in total real GDP is not the same as growth in real GDP per head. If real GDP grows by 3% and population grows by 2%, real GDP per head grows by only about 1% (1.03 ÷ 1.02 = 1.0098).
Worked example 1: from GDP to NNI
Country Veranda has the following data for one year ($ billion): GDP at market prices 800; indirect taxes 90; subsidies 15; net primary income from abroad −20; capital consumption 60.
- GDP at basic prices = 800 − 90 + 15 = $725 bn
- GNI (at market prices) = GDP + net primary income from abroad = 800 + (−20) = $780 bn. Net primary income is negative here. One possible reason is that foreign-owned firms in Veranda send home more profit than Veranda's residents earn abroad. Interest paid on foreign debt would have the same effect.
- NNI = GNI − capital consumption = 780 − 60 = $720 bn
Worked example 2: real GDP and real growth
Nominal GDP is $400 bn in Year 1 (the base year, price index 100) and $460 bn in Year 2, when the price index (GDP deflator) is 110.
- Nominal growth = (460 − 400) ÷ 400 × 100 = 15%
- Real GDP in Year 2 at Year 1 prices = 460 × 100 ÷ 110 = $418.18 bn (keep at least 2 d.p. in your working)
- Real growth = (418.18 − 400) ÷ 400 × 100 = 4.5% (to 1 d.p.)
Most of the 15% rise in money GDP came from rising prices. The volume of output grew by only about 4.5%. A quick check: 1.15 ÷ 1.10 = 1.045, so real growth is about 4.5%.
Tip: do not round intermediate values too early. If you round real GDP to 418.2, you get (418.2 − 400) ÷ 400 × 100 = 4.55, which rounds to 4.6%. That is not the correct answer.
The circular flow of income in outline
In the simplest model, households supply factor services to firms and receive incomes, then spend those incomes on firms' output. Money flows round in a circle. In a real economy some income leaks out of the flow and some spending is added to it from outside.
| Withdrawals (leakages) | Injections |
|---|---|
| Savings (S): income not spent | Investment (I): firms' spending on capital goods |
| Taxation (T): income taken by government | Government spending (G) on goods and services |
| Imports (M): spending that flows to foreign producers | Exports (X): spending by foreigners on domestic output |
If injections are greater than withdrawals, the flow of income grows. If withdrawals are greater than injections, it shrinks. National income is in equilibrium when I + G + X = S + T + M. The components do not have to match in pairs; only the totals must be equal.
2. Aggregate demand
Aggregate demand (AD) is the total planned spending on an economy's goods and services at each possible general price level in a given period.
AD = C + I + G + (X − M)
Components of AD
| Component | Meaning | Main influences |
|---|---|---|
| Consumption (C) | Household spending on goods and services. It is usually the largest component. | Disposable income, interest rates, wealth, consumer confidence, availability of credit, income tax |
| Investment (I) | Firms' spending on capital goods such as machinery and buildings, plus additions to stocks | Interest rates, expected future demand and profits (business confidence), technology, corporation tax |
| Government spending (G) | Government spending on goods and services such as teachers' salaries and roads. Transfer payments are excluded. | Government priorities, fiscal policy, the state of the economy |
| Net exports (X − M) | Foreign spending on domestic output minus domestic spending on foreign output | Exchange rate, relative inflation rates, incomes at home and abroad, product quality, protectionism |
Why the AD curve slopes downwards
The AD curve is drawn with the general price level on the vertical axis and real national output on the horizontal axis. It slopes down from left to right for three reasons:
- Real wealth effect: a higher price level reduces the real value of savings and other money assets, so households spend less.
- Interest rate effect: a higher price level raises the demand for money to pay for transactions. This pushes up interest rates, which reduces C and I.
- International trade effect: if domestic prices rise relative to foreign prices, exports become less competitive and imports more attractive, so (X − M) falls.
Movements along and shifts of AD
A change in the price level causes a movement along the AD curve. A change in any other influence on C, I, G or (X − M) shifts the curve. For example, lower interest rates, a rise in government spending, a fall in income tax, stronger confidence or a depreciation of the currency shift AD to the right. Higher interest rates, spending cuts, recession in trading partners or an appreciation of the currency shift AD to the left.
3. Aggregate supply
Aggregate supply (AS) is the total output of goods and services that producers in an economy are willing and able to supply at each possible general price level in a given period.
Short-run aggregate supply (SRAS)
In the short run the prices of factors of production, especially money wages, are assumed to be fixed. If the price level rises while costs stay the same, production becomes more profitable and firms increase output. The SRAS curve therefore slopes upwards.
SRAS shifts when costs of production change for all firms:
- Leftward shift (a fall in SRAS): higher money wages, higher prices of imported raw materials or energy, higher indirect taxes, a depreciation that raises import costs, or a supply shock such as a poor harvest.
- Rightward shift (a rise in SRAS): lower commodity prices, lower indirect taxes or higher subsidies to producers, an appreciation that makes imported inputs cheaper, or a short-term productivity gain.
Long-run aggregate supply (LRAS)
LRAS shows the economy's productive potential when all factor prices have had time to adjust. Economists hold two views of its shape.
| Classical (free-market) view | Keynesian view | |
|---|---|---|
| Shape | Vertical at the full-employment level of output (YFE) | Three sections: horizontal at low output, then upward-sloping, then vertical at full capacity |
| Reason | Wages and prices are flexible, so markets clear and the economy returns to full employment. Output in the long run depends on the quantity and quality of resources, not on the price level. | With large amounts of spare capacity, output can rise without costs rising. As bottlenecks appear, costs and prices rise. At full capacity, output cannot rise any further. |
| Effect of a rise in AD | In the long run, only the price level rises | Depends on the section: output rises (horizontal), both rise (upward section), only prices rise (vertical) |
Both views agree that LRAS shifts to the right when the quantity or quality of factors of production increases. Examples are a larger or better-educated labour force, net investment in capital, improvements in technology, discovery of natural resources, better infrastructure, and supply-side reforms that improve incentives or labour mobility. LRAS shifts left if productive capacity is destroyed, for example by a natural disaster, war or large-scale emigration of skilled workers.
4. Macroeconomic equilibrium
The economy is in equilibrium where AD = AS. This point gives the equilibrium general price level and the equilibrium level of real national output. If the price level were above equilibrium, planned output would exceed planned spending. Unsold stocks would build up, and firms would cut output and prices. The reverse happens below equilibrium.
Diagrams are not shown here, so the table below describes how the equilibrium changes after different shifts. Practise drawing each one: label the axes "price level" and "real output", and show the original and new equilibria.
| Change | Shift | Price level | Real output | Typical effect on unemployment |
|---|---|---|---|---|
| Government raises spending on roads | AD right | Rises | Rises (if there is spare capacity) | Falls |
| Central bank raises interest rates sharply | AD left | Falls (or rises more slowly) | Falls | Rises |
| World oil price doubles | SRAS left | Rises | Falls | Rises |
| Investment in training and technology over many years | LRAS right | Falls, or rises less | Rises | May fall |
The oil shock deserves attention. It is the one case in the table where higher inflation and lower output happen together, a situation sometimes called stagflation. Other adverse supply-side shocks have the same result: any leftward shift of SRAS, or a leftward shift of LRAS after a natural disaster or war. An AD shift, by contrast, moves the price level and output in the same direction.
How far a rise in AD raises output rather than prices depends on how much spare capacity the economy has. In the Keynesian model, a rightward AD shift in the horizontal section raises output only. In the vertical section it raises the price level only.
5. Economic growth
Economic growth is an increase in real GDP over time. Actual growth is an increase in the real output an economy produces. Potential growth is an increase in the economy's productive capacity.
On a production possibility curve (PPC), actual growth is shown as a movement from a point inside the curve towards the curve. Potential growth is an outward shift of the PPC. In AD/AS analysis, actual growth is usually shown by a rightward shift of AD when there is spare capacity. Potential growth is a rightward shift of LRAS.
When comparing living standards, look at growth in real GDP per head, not only total real GDP (see Section 1). If population grows faster than real GDP, average output per person falls even though the economy is growing.
Output gaps
- A negative output gap exists when actual output is below potential output. Resources are unemployed, and inflationary pressure is usually low.
- A positive output gap exists when actual output is above its sustainable potential level. Factors are being overworked, bottlenecks appear, and inflationary pressure builds.
Causes of economic growth
- Rising AD: higher consumer and business confidence, export demand or government spending, when spare capacity exists.
- More resources: population growth, net inward migration, higher participation of women in the labour force, discovery of minerals.
- Better quality resources: education and training (human capital), healthcare.
- Investment in physical capital and infrastructure, such as power generation, roads and broadband.
- Technological progress and innovation, which raise productivity (output per worker or per hour worked).
Consequences of economic growth
| Possible benefits | Possible costs |
|---|---|
| Higher average incomes and living standards | Environmental damage: pollution, deforestation, loss of non-renewable resources |
| More jobs, falling cyclical unemployment | Inflation if AD grows faster than productive capacity |
| Higher tax revenue without higher tax rates, funding health and education | Income inequality may widen if gains go mainly to owners of capital |
| Firms more willing to invest, which increases future capacity | Current account deficit if rising incomes pull in imports |
| Greater ability to reduce absolute poverty | Opportunity cost: investment for growth means less consumption now |
Sustainable growth is growth that meets present needs without reducing the ability of future generations to meet theirs. It has to take account of resource depletion and environmental damage.
6. Unemployment
Unemployment exists when people of working age who are willing and able to work, and are actively seeking work, cannot find a job.
Unemployment rate = (number unemployed ÷ labour force) × 100
The labour force (economically active population) is the employed plus the unemployed.
Measuring unemployment
| Method | How it works | Strengths | Limitations |
|---|---|---|---|
| Claimant count | Counts people who claim unemployment-related benefits | Cheap and quick to collect from administrative records, and available monthly | Leaves out unemployed people who are not eligible for benefits or do not claim them. It is affected by changes in benefit rules. It cannot be used where no benefit system exists. |
| Labour force survey (ILO measure) | A sample survey. People count as unemployed if they are without work, have actively looked for work recently and are available to start soon. | Uses an internationally agreed definition, so countries can be compared. It includes unemployed people who do not claim benefits. | Sampling error, costly to run, relies on honest answers |
Both methods can understate hidden unemployment: discouraged workers who have stopped looking, and underemployed people working fewer hours than they want. In economies with a large informal sector, official figures may say little about true labour market conditions.
Worked example 3: unemployment rate
A country has a working-age population of 60 million. Of these, 40 million are in the labour force and 36.8 million are employed.
- Number unemployed = labour force − employed = 40 − 36.8 = 3.2 million
- Unemployment rate = 3.2 ÷ 40 × 100 = 8%
Common error: dividing by the working-age population (3.2 ÷ 60 = 5.3%) is wrong. The 20 million economically inactive people (students, retired people, full-time carers) are not part of the labour force.
Types and causes of unemployment
| Type | Cause | Example |
|---|---|---|
| Frictional | Workers are between jobs and take time to search, because information is imperfect | A graduate spends two months applying for suitable posts |
| Structural | A long-term change in the pattern of demand or technology leaves workers whose skills or location no longer match the available jobs. Includes technological and regional unemployment. | Hand-loom weavers lose jobs as automated textile mills expand |
| Cyclical (demand-deficient) | A fall in AD in a downturn or recession reduces the derived demand for labour | Construction workers laid off when high interest rates reduce house building |
| Seasonal | Demand for some labour varies with the time of year | Hotel staff in hill resorts during winter; harvest workers after the harvest |
Frictional and structural unemployment can exist even when AD is high. Cyclical unemployment is the kind that disappears when a negative output gap closes.
Consequences of unemployment
- For the economy: lost output (the economy is inside its PPC). Lower tax revenue and higher spending on any benefits worsen the government budget. Skills are lost during long spells out of work, which can keep unemployment high even after demand recovers. (Extension, beyond AS: this lasting effect is called hysteresis.)
- For individuals: lower income and living standards, stress and poorer health, loss of skills and self-esteem.
- For society: greater inequality and poverty, and possible links to crime and social unrest.
- For firms: lower demand for their products. On the other hand, a larger pool of labour to recruit from and less upward pressure on wages.
7. Price stability
Inflation is a sustained increase in the general price level over a period of time.
Deflation is a sustained decrease in the general price level over a period of time.
Disinflation is a fall in the rate of inflation. Prices are still rising, but more slowly.
Measuring inflation: the consumer price index (CPI)
A CPI measures the change in the average price of a representative basket of goods and services bought by households. The steps are:
- Select a base year and give it an index of 100.
- Use a household expenditure survey to choose the basket and find what share of spending goes on each category. These shares are the weights.
- Collect prices of the items regularly from many outlets and regions.
- Calculate a price index for each category (current price ÷ base price × 100).
- Multiply each category index by its weight, add the results and divide by the total of the weights.
The rate of inflation is the percentage change in the CPI between two periods.
Worked example 4: a weighted consumer price index
Households in Country Tarsa spend 50% of their budget on food, 30% on transport and 20% on housing. Base year = Year 1.
| Category | Weight | Price in Year 1 (Rs) | Price in Year 2 (Rs) | Price index Year 2 | Weight × index |
|---|---|---|---|---|---|
| Food (weekly basket) | 50 | 4,000 | 4,400 | 4,400 ÷ 4,000 × 100 = 110 | 50 × 110 = 5,500 |
| Transport (monthly pass) | 30 | 2,000 | 2,100 | 2,100 ÷ 2,000 × 100 = 105 | 30 × 105 = 3,150 |
| Housing (monthly rent) | 20 | 25,000 | 30,000 | 30,000 ÷ 25,000 × 100 = 120 | 20 × 120 = 2,400 |
| Total | 100 | 11,050 |
- CPI in Year 2 = 11,050 ÷ 100 = 110.5
- Inflation between Year 1 and Year 2 = (110.5 − 100) ÷ 100 × 100 = 10.5%
Housing had the biggest price rise (20%) but a weight of only 20. Food rose by only 10%, but its large weight makes it the biggest contributor to the 10.5-point rise. Food adds 50 × 10 ÷ 100 = 5.0 points, housing adds 20 × 20 ÷ 100 = 4.0 points and transport adds 30 × 5 ÷ 100 = 1.5 points.
Extension: the CPI in Year 3 is 115.0. Inflation between Year 2 and Year 3 = (115.0 − 110.5) ÷ 110.5 × 100 = 4.1% (to 1 d.p.). It is not 4.5% and not 15%: always divide by the index of the earlier year, not by the base of 100.
Limitations of a CPI: the basket and weights may not match any particular household's spending. Quality improvements are hard to allow for. New products enter the basket with a delay. Consumers switch towards goods whose prices rise less. Prices are sampled, so there is sampling error.
Money values and real values: a CPI can convert money (nominal) values into real values. If a worker's money wage rises by 8% while prices rise by 10.5%, the worker's real wage has fallen by roughly 2.3% (1.08 ÷ 1.105 = 0.977).
Causes of inflation
| Demand-pull inflation | Cost-push inflation | |
|---|---|---|
| Definition | Inflation caused by AD rising faster than the economy's ability to supply output | Inflation caused by increases in costs of production that firms pass on as higher prices |
| AD/AS explanation | AD shifts right. Near full capacity, the price level rises more and output rises less. | SRAS shifts left. The price level rises and real output falls. |
| Typical triggers | Consumer credit boom, tax cuts, rapid rise in government spending, export boom, rapid growth of the money supply, falling interest rates | Higher wages not matched by productivity, higher prices of imported oil or raw materials, a depreciation raising import costs, higher indirect taxes |
| Effect on output and jobs | Output and employment usually rising | Output falling and unemployment rising |
The two can interact. Higher prices lead workers to demand higher wages, which raise costs and prices again. This is known as a wage-price spiral.
Consequences of inflation
- Lower purchasing power of money. People on fixed incomes, such as some pensioners, lose out, and so do savers whose interest rate is below the inflation rate.
- Redistribution from lenders to borrowers when inflation is unexpected, because debts are repaid in money of lower value.
- Menu costs: firms must spend time and money changing price lists. Shoe-leather costs: people make more effort to keep money in interest-bearing forms.
- Uncertainty makes planning harder and may discourage investment, harming long-run growth.
- International competitiveness: if domestic inflation is higher than in trading partners and the exchange rate does not change, exports become dearer and imports cheaper, which worsens the current account.
- Fiscal drag: if tax thresholds are not raised with inflation, people move into higher tax bands.
- Low, stable and anticipated inflation causes far fewer problems than high or unexpected inflation. Mild inflation can encourage firms by raising money profits.
Deflation
Deflation can be benign ("good") when it results from rising productivity or falling costs, so SRAS/LRAS shift right. Output rises while prices fall. It is malign ("bad") when it results from falling AD. Then consumers delay purchases in expectation of lower prices, firms cut output and jobs, the real value of debt rises, and a downward spiral of falling demand can set in.
8. International trade
Absolute and comparative advantage
Absolute advantage: a country has an absolute advantage in a good if it can produce more of that good than another country using the same quantity of resources.
Comparative advantage: a country has a comparative advantage in a good if it can produce that good at a lower opportunity cost than another country.
The principle of comparative advantage says that total world output can rise if each country specialises in the good in which it has a comparative advantage and then trades. This holds even if one country has an absolute advantage in both goods. What matters is a difference in opportunity costs.
Worked example 5: comparative advantage and the gains from trade
Two countries, Norland and Soria, each have 100 workers. One worker can produce, per day:
| Country | Wheat (tonnes) | Cloth (bales) |
|---|---|---|
| Norland | 20 | 10 |
| Soria | 12 | 4 |
Step 1: absolute advantage. Norland produces more of both goods per worker, so it has an absolute advantage in both wheat and cloth.
Step 2: opportunity costs.
| Country | Opportunity cost of 1 bale of cloth | Opportunity cost of 1 tonne of wheat |
|---|---|---|
| Norland | 20 ÷ 10 = 2 tonnes of wheat | 10 ÷ 20 = 0.5 bales of cloth |
| Soria | 12 ÷ 4 = 3 tonnes of wheat | 4 ÷ 12 = 0.33 bales of cloth |
Step 3: comparative advantage. Norland gives up less wheat per bale of cloth (2 < 3), so it has a comparative advantage in cloth. Soria gives up less cloth per tonne of wheat (0.33 < 0.5), so it has a comparative advantage in wheat.
Step 4: output before specialisation. Suppose each country splits its workers 50/50.
| Country | Wheat | Cloth |
|---|---|---|
| Norland | 50 × 20 = 1,000 | 50 × 10 = 500 |
| Soria | 50 × 12 = 600 | 50 × 4 = 200 |
| World total | 1,600 | 700 |
Step 5: output after specialisation. Soria specialises completely in wheat. Norland moves workers towards cloth but keeps 20 workers on wheat so that world wheat output does not fall.
| Country | Wheat | Cloth |
|---|---|---|
| Norland (20 workers wheat, 80 cloth) | 20 × 20 = 400 | 80 × 10 = 800 |
| Soria (100 workers wheat) | 100 × 12 = 1,200 | 0 |
| World total | 1,600 | 800 |
World cloth output rises by 100 bales with no loss of wheat. This is the gain from specialisation.
Step 6: trade. For both countries to gain, the terms of trade must lie between their opportunity costs: between 2 and 3 tonnes of wheat per bale of cloth. Suppose they agree on 2.5 tonnes per bale, and Norland exports 240 bales of cloth in exchange for 240 × 2.5 = 600 tonnes of wheat.
| Country | Consumption after trade | Compared with before |
|---|---|---|
| Norland | Wheat 400 + 600 = 1,000; Cloth 800 − 240 = 560 | Same wheat, +60 cloth |
| Soria | Wheat 1,200 − 600 = 600; Cloth 0 + 240 = 240 | Same wheat, +40 cloth |
Both countries consume more than they could produce alone. Check: 60 + 40 = 100 extra bales, which matches the world gain.
Limitations of the theory: it assumes constant opportunity costs, no transport costs, perfectly mobile factors within each country and no trade barriers. In reality, specialisation creates dependence on a narrow range of products. Workers in declining industries may face structural unemployment. Comparative advantage can also change over time.
Other benefits of free trade
Beyond the gains from specialisation, trade gives consumers wider choice and lower prices. It lets firms gain economies of scale by selling to larger markets, increases competition and efficiency, and spreads technology and ideas.
Terms of trade
Terms of trade = (index of average export prices ÷ index of average import prices) × 100
A rise in the index is a favourable (improving) movement: each unit of exports buys more imports. A fall is an unfavourable (deteriorating) movement.
Worked example 6: terms of trade
In the base year both price indices are 100. Two years later the export price index is 115 and the import price index is 125.
- Terms of trade = 115 ÷ 125 × 100 = 92
- The index has fallen from 100 to 92, an 8% deterioration. A given volume of exports now pays for 8% fewer imports.
"Favourable" does not always mean "good", and "unfavourable" does not always mean "bad". If the terms of trade improve because domestic inflation has pushed up export prices, export volumes may fall and hurt the current account and jobs. If they deteriorate because higher productivity has lowered export prices, export volumes and income may rise, provided demand for exports is price elastic. How good a change is depends on its cause and on price elasticities of demand.
Causes of changes in the terms of trade: changes in world demand and supply for commodities (important for countries exporting cotton, rice or oil), relative inflation rates, exchange rate changes and productivity changes.
Protectionism
Protectionism is the use of measures by a government to restrict imports in order to protect domestic producers from foreign competition.
| Method | How it works |
|---|---|
| Tariff (import duty) | A tax on imports that raises their price in the domestic market and earns government revenue |
| Import quota | A physical limit on the quantity or value of a good that may be imported |
| Subsidy to domestic producers | Lowers domestic firms' costs so they can compete with imports or sell abroad more cheaply |
| Embargo | A complete ban on trade in a good or with a country |
| Administrative (non-tariff) barriers | Excessive paperwork, strict product standards or slow customs procedures that make importing harder |
| Exchange controls | Limits on the foreign currency available to pay for imports |
Worked example 7: effects of a tariff
A small economy can import a good at a world price of $4 per unit. At $4, domestic demand is 100,000 units and domestic firms supply 30,000 units, so imports are 70,000. The government imposes a tariff of $1 per unit. At the new domestic price of $5, demand is 90,000 and domestic supply is 45,000.
- New imports = 90,000 − 45,000 = 45,000 units (down from 70,000)
- Tariff revenue = tariff per unit × units imported = $1 × 45,000 = $45,000
- Consumers pay $1 more and buy 10,000 fewer units. Assuming straight-line demand and supply curves, the loss of consumer surplus = $1 × (100,000 + 90,000) ÷ 2 = $95,000.
- Domestic producers sell 15,000 more units at a higher price. Gain in producer surplus = $1 × (30,000 + 45,000) ÷ 2 = $37,500. Output and employment in the industry rise.
- Net welfare (deadweight) loss = 95,000 − 37,500 − 45,000 = $12,500. This is made up of:
- production inefficiency: ½ × $1 × 15,000 = $7,500. Resources move into higher-cost domestic production, which is a loss of allocative efficiency.
- lost consumption: ½ × $1 × 10,000 = $5,000. Consumers no longer buy units they valued above the world price.
Practise drawing: put price on the vertical axis and quantity on the horizontal axis. Draw domestic supply (Sd) and domestic demand (Dd), a horizontal world price line at Pw = $4 and a horizontal line at Pw + t = $5. Mark quantities 30,000, 45,000, 90,000 and 100,000. The four areas between the two price lines are:
| Area between $4 and $5 | Quantity range | Meaning | Value |
|---|---|---|---|
| Trapezium to the left of Sd | 0 to 45,000 (above Sd) | Gain in producer surplus | $37,500 |
| Triangle between Sd and the $5 line | 30,000 to 45,000 | Production inefficiency (deadweight loss) | $7,500 |
| Rectangle | 45,000 to 90,000 | Tariff revenue | $45,000 |
| Triangle between Dd and the $5 line | 90,000 to 100,000 | Lost consumption (deadweight loss) | $5,000 |
Check: the four areas add up to the loss of consumer surplus: 37,500 + 7,500 + 45,000 + 5,000 = 95,000.
| Arguments for protection | Arguments against protection |
|---|---|
| Infant industry: new industries need temporary protection until they reach economies of scale | Protection may become permanent and firms may never become efficient |
| Anti-dumping: prevents foreign firms selling below cost to drive out domestic rivals | Genuine dumping is hard to prove; the claim can hide ordinary protectionism |
| Protecting jobs in declining or threatened industries | Jobs saved may be outweighed by jobs lost in export industries if other countries retaliate |
| Strategic reasons: food, energy and defence security | Consumers pay higher prices and have less choice |
| Reducing a current account deficit | Treats the symptom rather than the cause (lack of competitiveness) |
| Government revenue from tariffs, useful where other taxes are hard to collect | Reduces world output by going against comparative advantage; higher-cost imported inputs raise firms' costs |
9. The balance of payments
The balance of payments is a record of all financial transactions between the residents of a country and the rest of the world over a given period.
It has three accounts. The current account records trade in goods and services and income flows. The capital account records items such as debt forgiveness and the transfer of ownership of non-produced assets. The financial account records flows of direct investment, portfolio investment, other investment such as loans and deposits, and changes in reserve assets. Because every transaction has two sides, the accounts should in principle sum to zero overall. Any recording error appears as "net errors and omissions".
Components of the current account
| Component | What it includes | Example of a credit (money in) |
|---|---|---|
| Trade in goods | Exports and imports of physical items (visible trade) | Sale of surgical instruments to Germany |
| Trade in services | Exports and imports of services (invisible trade): tourism, transport, banking, IT, insurance | A foreign tourist's hotel spending; software services sold to a US firm |
| Primary income | Compensation of employees working abroad for a short period, and investment income: profits, dividends and interest | Interest received on a resident's holdings of foreign bonds |
| Secondary income | Current transfers between residents and non-residents where nothing is received in return | Workers' remittances sent home by nationals living abroad; foreign aid grants |
Worked example 8: current account balance ($ billion)
| Item | Credits | Debits | Balance |
|---|---|---|---|
| Goods | 30 | 52 | 30 − 52 = −22 |
| Services | 8 | 10 | 8 − 10 = −2 |
| Primary income | 2 | 6 | 2 − 6 = −4 |
| Secondary income | 29 | 2 | 29 − 2 = +27 |
| Current account | −22 − 2 − 4 + 27 = −1 |
The combined deficit on goods, services and primary income (−$28 bn) is almost entirely offset by remittances (secondary income, +$27 bn). The current account deficit of $1 bn must be financed by net inflows on the capital and financial accounts, for example inward investment, borrowing from abroad or running down reserves.
Causes of current account deficits
- Cyclical: rapid growth of domestic incomes (high AD) pulls in imports. Recession in trading partners reduces exports.
- Structural: low productivity, poor product quality or relatively high domestic inflation make exports uncompetitive. The country may depend heavily on imported energy or capital goods.
- Exchange rate: an overvalued currency makes exports dear and imports cheap.
- Terms of trade shocks: a sharp rise in oil or food import prices when demand for them is price inelastic.
Consequences of current account imbalances
| Deficit | Surplus |
|---|---|
| Net withdrawal from the circular flow, which lowers AD, output and employment | Net injection that raises AD, output and employment, but may add to demand-pull inflation |
| Must be financed by borrowing, selling assets or using reserves; a persistent deficit can lead to rising foreign debt and a currency crisis | Builds up foreign assets and reserves |
| Downward pressure on a floating exchange rate | Upward pressure on the exchange rate, which reduces competitiveness |
| Not always harmful: a deficit caused by imports of capital goods may raise future productive capacity | One country's surplus is another's deficit; may lead to trade disputes and retaliation |
A small, temporary imbalance is rarely a problem. A large, persistent deficit caused by lack of competitiveness is more serious.
10. Exchange rates
The exchange rate is the price of one currency expressed in terms of another currency.
Depreciation is a fall in the value of a currency in a floating exchange rate system. Appreciation is a rise in its value in a floating system.
Devaluation and revaluation are a deliberate lowering or raising of a currency's value by the authorities under a fixed exchange rate system.
Measuring exchange rates
Nominal exchange rate: the rate at which one currency is quoted against another, for example $1 = Rs 280.
Real exchange rate: the nominal rate adjusted for relative price levels. It shows international competitiveness. With the rate measured as units of foreign currency per unit of domestic currency:
real exchange rate index = nominal exchange rate index × (domestic price index ÷ foreign price index)
Illustration: the nominal rate does not change, but domestic prices rise by 10% while foreign prices rise by 2%. Real exchange rate index = 100 × 110 ÷ 102 = 107.8. There is a real appreciation of about 7.8%, so the country's exports have become less competitive even though the nominal rate is unchanged.
Trade-weighted (effective) exchange rate: an index of a currency's value against a basket of trading partners' currencies. Each partner is weighted by its share of the country's trade.
Illustration: 60% of a country's trade is with Country A and 40% with Country B. Its currency rises by 5% against A's currency and falls by 10% against B's. Weighted change = (0.6 × 5) + (0.4 × −10) = 3 − 4 = −1%, so the index falls from 100 to 99.
Exchange rate systems
| System | How the rate is set | Advantages | Disadvantages |
|---|---|---|---|
| Floating | By market demand for and supply of the currency, with no government intervention | Adjusts automatically towards correcting a current account imbalance; no need to hold large reserves; interest rates are free for domestic goals | Volatile rates create uncertainty for traders and investors; depreciation can import inflation |
| Fixed | The government or central bank sets a value against another currency (a peg) and maintains it by buying or selling currency and by changing interest rates | Certainty for traders; discipline against inflation | Requires large reserves; interest rates must defend the peg rather than support domestic output; risk of speculative attack |
| Managed float | Mostly market-determined, but the central bank intervenes to limit sharp swings or keep the rate in an unofficial range | Some flexibility with less volatility | Needs reserves; the authorities may misjudge the right level; can be seen as manipulation by trading partners |
Determination of a floating exchange rate
Demand for a country's currency comes from foreigners buying its exports, foreign investors buying its assets, remittance inflows and speculators expecting a rise. Supply of the currency comes from residents buying imports, investing abroad, and speculators selling. The rate settles where demand equals supply. The currency appreciates if, for example, exports increase, domestic interest rates rise relative to those abroad (attracting "hot money"), or inward investment increases. It depreciates if imports rise, domestic inflation is relatively high, interest rates fall, or confidence falls.
Worked example 9: effects of a depreciation
The rupee–dollar rate moves from $1 = Rs 250 to $1 = Rs 280. It now takes more rupees to buy a dollar, so the rupee has depreciated and the dollar has appreciated.
- A shirt exported at Rs 5,600: price in the US before = 5,600 ÷ 250 = $22.40; after = 5,600 ÷ 280 = $20.00. Exports become cheaper to foreign buyers.
- A machine part imported at $50: price in Pakistan before = 50 × 250 = Rs 12,500; after = 50 × 280 = Rs 14,000. Imports become dearer at home.
- The dollar has appreciated by (280 − 250) ÷ 250 × 100 = 12% against the rupee. The rupee's value in dollars fell from 1/250 = $0.0040 to 1/280 = $0.00357, a depreciation of about 10.7%. The two percentages are not the same.
Effects of depreciation and appreciation
| Variable | Depreciation | Appreciation |
|---|---|---|
| Export prices in foreign currency | Fall, so exports become more competitive | Rise, so exports become less competitive |
| Import prices in domestic currency | Rise | Fall |
| Current account | Likely to improve if demand for exports and imports is sufficiently price elastic (extension, A Level: it may worsen at first before improving) | Likely to worsen, on the same condition |
| AD, output and employment | (X − M) is likely to rise if demand is price elastic, so AD shifts right | (X − M) is likely to fall on the same condition, so AD shifts left |
| Inflation | Likely to rise: dearer imported goods and raw materials (cost-push) plus higher AD (demand-pull) | Likely to fall: cheaper imports and lower AD |
| Foreign-currency debt | Becomes more expensive to repay in domestic currency | Becomes cheaper to repay |
Evaluation point: the size of the effect depends on the price elasticities of demand for exports and imports, on how much spare capacity exporters have, on whether rivals' currencies are also falling, and on how dependent exporters are on imported inputs.
Key terms
| Term | Definition |
|---|---|
| Gross domestic product (GDP) | Total value of goods and services produced within a country in a given period |
| Gross national income (GNI) | GDP plus net primary income from abroad |
| Net national income (NNI) | GNI minus capital consumption (depreciation) |
| Real value | A value adjusted for changes in the price level |
| Real GDP per head | Real GDP divided by population |
| Aggregate demand | Total planned spending on an economy's output at each price level: C + I + G + (X − M) |
| Aggregate supply | Total output producers are willing and able to supply at each price level |
| Macroeconomic equilibrium | The price level and real output at which AD equals AS |
| Economic growth | An increase in real GDP over time |
| Output gap | The difference between actual and potential output |
| Labour force | People of working age who are employed or unemployed (economically active) |
| Structural unemployment | Unemployment caused by a mismatch between workers' skills or location and available jobs after long-term change in the economy |
| Cyclical unemployment | Unemployment caused by insufficient aggregate demand |
| Inflation | A sustained increase in the general price level |
| Deflation | A sustained decrease in the general price level |
| Disinflation | A fall in the rate of inflation; prices still rise, but more slowly |
| Consumer price index | A weighted index of the prices of a representative basket of goods and services bought by households |
| Comparative advantage | Ability to produce a good at a lower opportunity cost than another country |
| Terms of trade | Index of export prices ÷ index of import prices × 100 |
| Protectionism | Government measures that restrict imports to protect domestic producers |
| Current account | The part of the balance of payments recording trade in goods and services, primary income and secondary income |
| Nominal exchange rate | The rate at which one currency is quoted against another |
| Real exchange rate | The nominal exchange rate adjusted for relative price levels; a measure of competitiveness |
| Trade-weighted (effective) exchange rate | An index of a currency's value against a basket of trading partners' currencies, weighted by each partner's share of trade |
| Managed float | An exchange rate mainly set by the market, with occasional central bank intervention |
| Depreciation (of a currency) | A fall in a currency's value under a floating exchange rate |
Common confusions
- Terms of trade vs balance of trade: the terms of trade compare export prices with import prices (an index). The balance of trade is the value of exports minus the value of imports (a money amount). Favourable terms of trade can go with a trade deficit.
- Current account deficit vs budget deficit: a current account deficit is about the country's transactions with the rest of the world. A budget deficit is government spending greater than government revenue. They are different things.
- Disinflation vs deflation: a fall in inflation from 8% to 3% means prices are still rising, only more slowly. Only negative inflation is deflation.
- Nominal vs real: a rise in nominal GDP or wages does not mean output or living standards have risen. Always adjust for prices.
- Two meanings of depreciation: a fall in the value of a currency, or capital consumption (the wearing out of capital) in national income accounts.
Quick check
- Define inflation. [2]
- State the four components of aggregate demand. [2]
- A country's labour force is 25 million and 1.5 million people are unemployed. Calculate the unemployment rate. [2]
- Explain the difference between GDP and GNI. [2]
- A country's GDP is $500 bn, net primary income from abroad is +$12 bn and capital consumption is $40 bn. Calculate its GNI and NNI. [2]
- Coal miners lose their jobs as power stations switch to solar energy, and local employers do not need their skills. Identify the type of unemployment and give a reason. [2]
- An economy's export price index is 108 and its import price index is 90. Calculate the terms of trade and state whether they have moved favourably or unfavourably from a base of 100. [2]
- Nominal GDP rises from $250 bn to $270 bn while the price index rises from 100 to 105. Calculate the rate of real economic growth to one decimal place. [3]
- A CPI has two categories: food (weight 60), whose price index rises to 115, and clothing (weight 40), whose price index rises to 105. Calculate the CPI and the rate of inflation from the base year. [3]
- A country's balances ($ bn) are: goods −15, services +6, primary income −3, secondary income +4. Calculate the current account balance. [2]
- An exporter sells a product for Rs 9,000. The exchange rate changes from $1 = Rs 200 to $1 = Rs 225. Calculate the dollar price of the product before and after the change. [2]
- In one hour, Country P can produce 8 phones or 16 shirts, and Country Q can produce 3 phones or 12 shirts. Identify which country has a comparative advantage in each good, showing your working. [4]
- Explain the difference between demand-pull and cost-push inflation, using AD/AS analysis. [4]
- Explain two reasons why a country might have a current account deficit. [4]
- Analyse the likely effects of a depreciation of a country's currency on its inflation rate and its level of unemployment. [8]
- Assess whether a government should use tariffs to protect a domestic industry from foreign competition. [12]
1. A sustained increase [1] in the general (average) price level over a period of time [1].
2. Consumption, investment, government spending, and net exports (exports minus imports). All four = [2]; two or three = [1].
3. 1.5 ÷ 25 × 100 [1] = 6% [1].
4. GDP measures output produced within the country's borders [1]. GNI adds net primary income from abroad, so it measures the income of the country's residents wherever it is earned [1].
5. GNI = 500 + 12 = $512 bn [1]. NNI = 512 − 40 = $472 bn [1].
6. Structural unemployment [1]. A long-term change in technology and demand has left workers whose skills no longer match the jobs available [1].
7. 108 ÷ 90 × 100 = 120 [1]. This is a favourable movement (improvement), because the index is above 100 [1].
8. Real GDP in the second year = 270 × 100 ÷ 105 = $257.14 bn [1]. Real growth = (257.14 − 250) ÷ 250 × 100 [1] = 2.9% [1]. (Nominal growth was 8%.)
9. (60 × 115) + (40 × 105) = 6,900 + 4,200 = 11,100 [1]. CPI = 11,100 ÷ 100 = 111 [1]. Inflation = 11% [1].
10. −15 + 6 − 3 + 4 [1] = −$8 bn, a current account deficit of $8 bn [1].
11. Before: 9,000 ÷ 200 = $45.00 [1]. After: 9,000 ÷ 225 = $40.00 [1].
12. Country P: 1 phone costs 16 ÷ 8 = 2 shirts; 1 shirt costs 0.5 phones [1]. Country Q: 1 phone costs 12 ÷ 3 = 4 shirts; 1 shirt costs 0.25 phones [1]. P has the lower opportunity cost of phones (2 < 4 shirts), so P has a comparative advantage in phones [1]. Q has the lower opportunity cost of shirts (0.25 < 0.5 phones), so Q has a comparative advantage in shirts [1]. (P has an absolute advantage in both goods, but that is not what the question asks.)
13. Demand-pull inflation is caused by AD increasing faster than the economy's productive capacity [1]. It is shown by AD shifting right, which raises the price level as the economy approaches full capacity, with output rising [1]. Cost-push inflation is caused by rising costs of production, such as wages or imported raw materials, passed on in higher prices [1]. It is shown by SRAS shifting left, which raises the price level while real output falls [1].
14. Any two, each explained [2 + 2]:
- High domestic incomes/growth: rising incomes increase spending on imports faster than exports grow, so M rises above X.
- Uncompetitive exports: higher domestic inflation than in trading partners, or low productivity, makes exports relatively dear, so export volumes fall and imports rise.
- An overvalued exchange rate: exports are expensive in foreign currency and imports cheap in domestic currency.
- A rise in the price of an essential import with inelastic demand (for example oil) increases import spending.
- Large net outflows of primary income, such as profits sent home by foreign-owned firms.
Questions 15 and 16 are extended answers marked by level: decide which description fits the answer best, then choose a mark within that level. This self-marking guide follows the style of levels-based marking. It is not an official mark scheme.
15. [8] Points a good answer uses:
- A depreciation makes exports cheaper in foreign currency and imports dearer in domestic currency.
- Inflation: dearer imported raw materials, fuel and components raise firms' costs, so SRAS shifts left (cost-push). Dearer imported consumer goods raise the CPI directly. Higher net exports shift AD right, adding demand-pull pressure. Inflation is therefore likely to rise, especially if the economy is near full capacity or relies heavily on imports.
- Unemployment: if demand for exports and imports is price elastic, export volumes rise and some spending switches from imports to domestic goods. (X − M) and AD increase, firms raise output, and the derived demand for labour rises, reducing cyclical unemployment.
- Qualification: if demand is inelastic, or exporters lack spare capacity, the gain in output and jobs is small while the inflationary effect remains. Rising costs could even reduce output in import-dependent industries.
| Level | Marks | Description |
|---|---|---|
| 3 | 6–8 | Accurate, developed analysis of the effects on both inflation and unemployment, with clear chains of reasoning linked to AD/AS (cost-push, demand-pull, derived demand for labour) and to the role of price elasticity |
| 2 | 3–5 | Correct explanation of some effects, but chains of reasoning are incomplete, or only one of inflation and unemployment is analysed well |
| 1 | 1–2 | A few relevant points, mostly described or asserted, with little explanation |
| 0 | 0 | Nothing creditworthy |
Model paragraph (one developed chain): A depreciation raises the domestic-currency price of imports. If the country imports much of its fuel and raw materials, firms' costs rise, so SRAS shifts to the left and the general price level rises. This is cost-push inflation. At the same time, exports become cheaper in foreign currency. If demand for exports is price elastic, export volumes rise, and some domestic spending switches from imports to home-produced goods. (X − M) rises and AD shifts to the right. Firms need more workers to produce the extra output, because labour is a derived demand, so cyclical unemployment falls. If the economy is already near full capacity, however, the AD shift mainly raises the price level, which adds to the inflation.
16. [12] Points a good answer uses:
- For: the tariff raises the domestic price of imports, so domestic producers sell more, and output and jobs in the industry are protected. It may let an infant industry grow and gain economies of scale until it can compete. It raises government revenue. It may reduce import spending and improve the current account. It may be justified for strategic industries or against proven dumping.
- Against: consumers pay higher prices and have less choice, and consumer surplus falls. Resources are moved away from comparative advantage, so world and domestic efficiency fall. Protected firms may have little incentive to become efficient, so "temporary" protection becomes permanent. Trading partners may retaliate with tariffs on this country's exports, which costs jobs elsewhere. Firms that use the product as an input face higher costs, which harms their competitiveness. A tariff may break international trade agreements.
- Judgement: a tariff is more justifiable if it is temporary, targeted at a genuine infant or strategic industry or at proven dumping, and accompanied by measures to raise productivity. It is less justified as a long-term way to protect an uncompetitive industry. There, supply-side policies (training, investment, infrastructure) tackle the cause rather than the symptom. The final answer depends on the size of the tariff, the likelihood of retaliation, and the price elasticities of demand and supply.
Mark the analysis and the evaluation separately, then add the two marks together.
| Knowledge and analysis | Marks | Description |
|---|---|---|
| Level 3 | 6–8 | Developed, accurate analysis of arguments both for and against the tariff (for example effects on prices, domestic output and jobs, government revenue, efficiency, retaliation), with clear chains of reasoning |
| Level 2 | 3–5 | Some accurate analysis, but one-sided or not fully developed |
| Level 1 | 1–2 | A list of relevant points with little explanation |
| Evaluation | Marks | Description |
|---|---|---|
| Level 2 | 3–4 | A justified conclusion that answers "should", weighs the arguments and says what the answer depends on |
| Level 1 | 1–2 | Some evaluative comment, or a conclusion that is stated rather than supported |
Model evaluative paragraph: Whether a tariff is justified depends on why the industry is struggling. If it is a genuine infant industry whose costs will fall as it grows, a temporary, clearly time-limited tariff may let it reach economies of scale, and the long-run gain could outweigh the short-run loss to consumers. But if the industry is uncompetitive because of low productivity, a tariff only treats the symptom. Consumers keep paying higher prices, the protected firms have little incentive to improve, and trading partners may retaliate against the country's exports. In that case, supply-side measures such as training and investment are a better answer. On balance, a tariff is justified only if it is temporary and targeted, and retaliation is unlikely.
