
A Level · Economics 9708 · Microeconomics
Market Structures 1
Typed from the teacher’s handwritten class notes. The original pages are one tap away.
Opens inside this page, as often as you like. This note is read online only; the whole set is in the study pack below.
Check yourself
5 quick questions on A Level Economics
Tap an answer to see if you are right, and why. Free, no sign-up.
Start the free test👍 6 students found these notes useful
Was this note useful?
Full text of Market Structures 1
Mega Lecture notes for A Level Economics (9708), A2: perfect competition, monopoly, monopolistic competition and oligopoly, with the equilibrium diagrams, game theory and a comparison table. Based on the classes of Qasim Shamim, Mega Lecture Economics teacher.
1. What a market structure is
A market (or industry) is the collection of firms that produce the same type of product. The two words are used interchangeably: the mobile phone industry means all the firms that make mobile phones, such as Apple, Samsung and Huawei.
Market structure is the study of the economic characteristics of a market that decide how its firms behave: how many firms there are, how similar their products are, how easy it is to enter or leave, and how much control each firm has over its price.
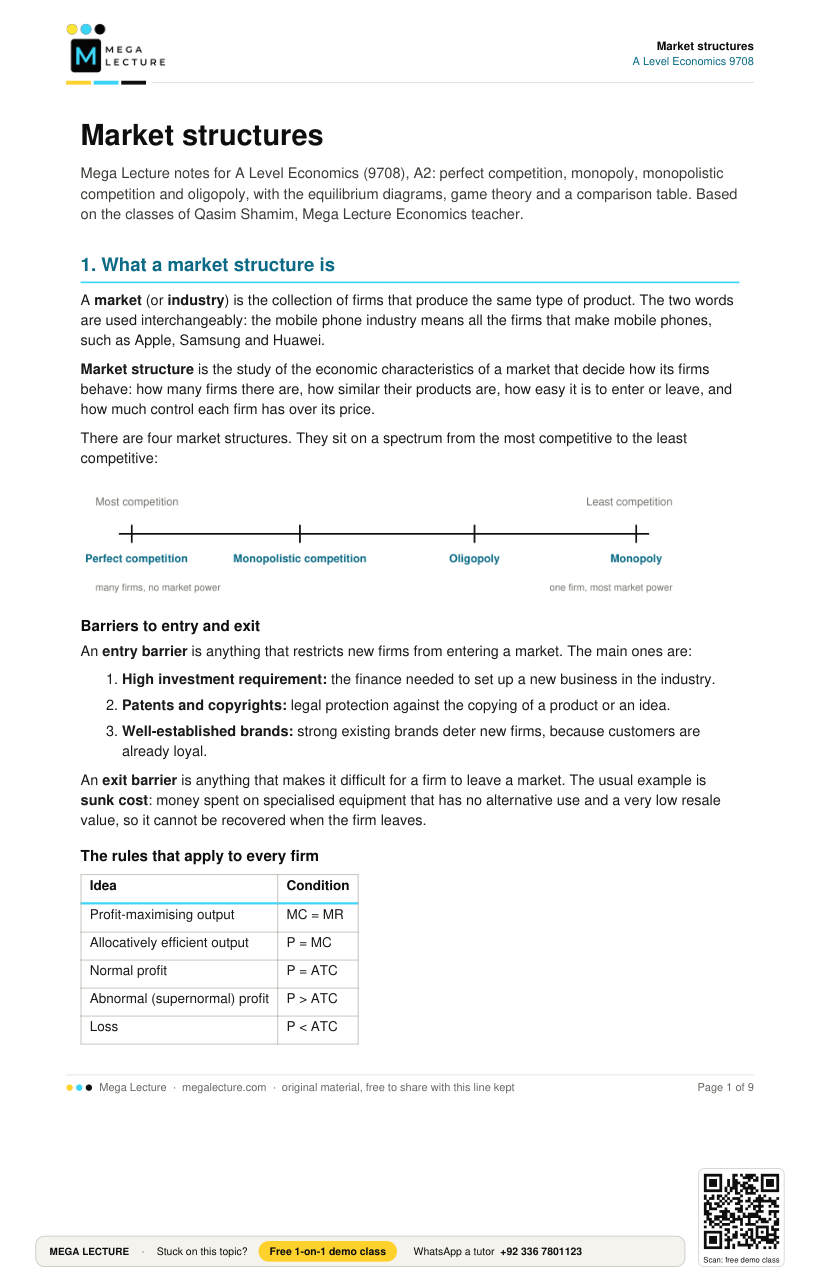
There are four market structures. They sit on a spectrum from the most competitive to the least competitive:
Barriers to entry and exit
An entry barrier is anything that restricts new firms from entering a market. The main ones are:
- High investment requirement: the finance needed to set up a new business in the industry.
- Patents and copyrights: legal protection against the copying of a product or an idea.
- Well-established brands: strong existing brands deter new firms, because customers are already loyal.
An exit barrier is anything that makes it difficult for a firm to leave a market. The usual example is sunk cost: money spent on specialised equipment that has no alternative use and a very low resale value, so it cannot be recovered when the firm leaves.
The rules that apply to every firm
| Idea | Condition |
|---|---|
| Profit-maximising output | MC = MR |
| Allocatively efficient output | P = MC |
| Normal profit | P = ATC |
| Abnormal (supernormal) profit | P > ATC |
| Loss | P < ATC |
Normal profit means the business earns just enough to match what its resources could have earned in their next best use, in some other industry. It is the minimum needed to keep the firm where it is. Abnormal profit is anything above that. Abnormal profit is the incentive for new firms to enter a market; when firms earn only normal profit, there is no incentive for new firms to enter or for existing firms to leave.
How to read profit from any of the diagrams below: find the output Q where MC = MR, go up to the demand curve to read the price P, and go to the ATC curve to read the cost per unit C. Profit per unit is P − C, and total profit is (P − C) × Q, the shaded rectangle.
2. Perfect competition
Perfect competition is the most competitive market structure. It is not very common, although some agricultural markets (wheat, for example) come close. Economists use it as a benchmark for economic efficiency against which other markets are judged.
Characteristics
- Many sellers (and many buyers), each too small to matter on its own.
- Homogeneous products: every firm's product is identical, with no branding or advertising.
- Firms are price takers. Each firm supplies a tiny part of the market, so nothing it does changes the market price. Its demand curve is a horizontal line at the market price: perfectly elastic demand, with D = AR = MR.
- Low or no barriers to entry and exit.
- Perfect information: consumers know every firm's price.
Short-run equilibrium
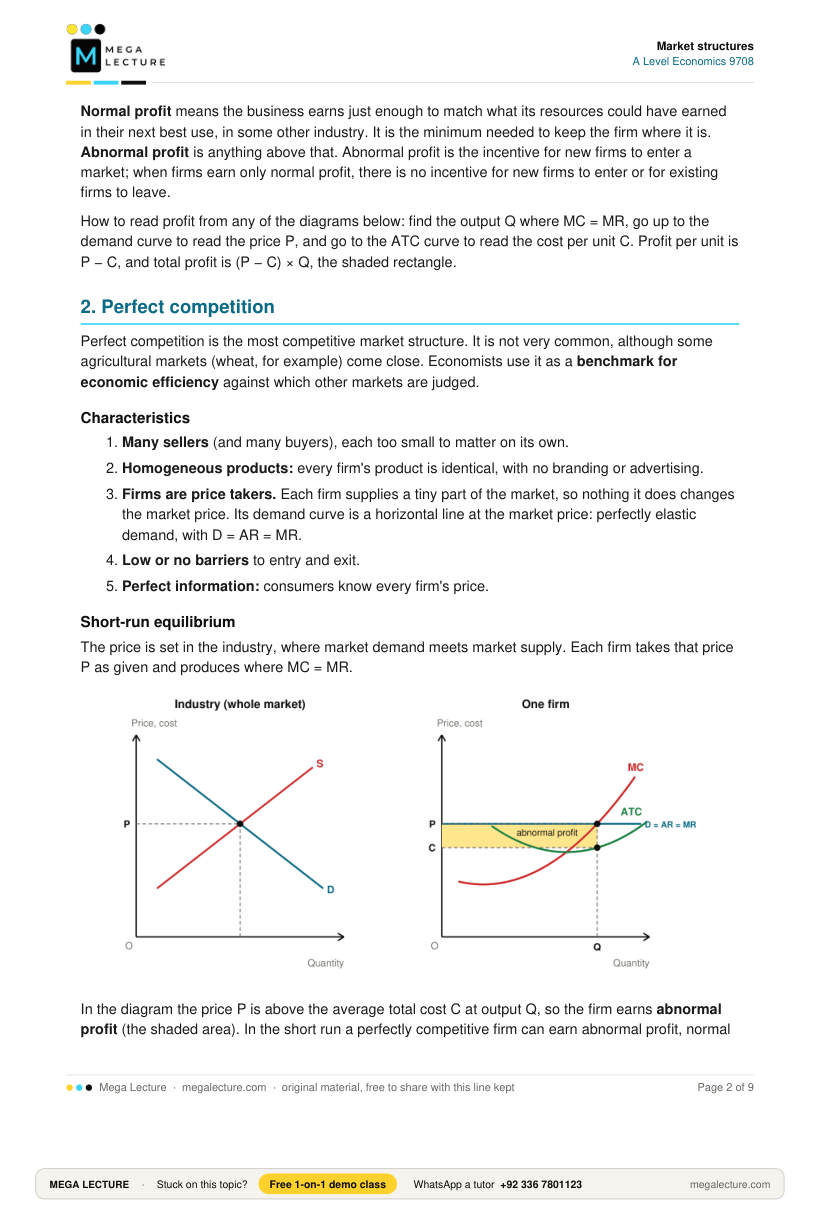
The price is set in the industry, where market demand meets market supply. Each firm takes that price P as given and produces where MC = MR.
In the diagram the price P is above the average total cost C at output Q, so the firm earns abnormal profit (the shaded area). In the short run a perfectly competitive firm can earn abnormal profit, normal profit or a loss, depending on where the market price lies against its ATC; the abnormal profit case is the one drawn most often.
Long-run equilibrium
Abnormal profit attracts new firms, and there are no barriers to stop them. As they enter, market supply shifts to the right (S to S1) and the price falls from P to P1. Entry continues until the price equals the lowest point of ATC.
In the long run every firm earns normal profit only (P1 = ATC). At that point P = MC, so the firm is allocatively efficient, and it produces at the lowest point of ATC, so it is productively efficient. (If firms were making losses, some would leave, supply would shift left and the price would rise back to the same point.)
3. Monopoly
Monopoly is the least competitive market structure, at the other end of the spectrum. A pure monopoly is a market with a single supplier; in practice a market with one dominant firm is also treated as a monopoly. For simplicity the theory assumes one producer. A natural monopoly is an industry where one firm can supply the whole market at a lower cost than two or more could, usually because of very high fixed costs: water, gas and electricity networks and railways are examples, and they are often state owned.
Characteristics
- A single firm satisfies the whole market demand for a product that has no close substitutes.
- High barriers to entry and exit: an established brand and a high set-up cost keep new firms out, and sunk costs make exit expensive.
- The monopolist is a price maker. Because it is the whole supply, it can choose its price (or its output, but not both: the demand curve decides the other).
- The demand curve slopes downwards, because the firm's demand curve is the market demand curve. With no close substitutes, demand is less elastic than for firms in the other market structures, so the curve is drawn steep. MR lies below (to the left of) the demand curve, because to sell one more unit the firm must lower the price on all units.
- Abnormal profit in both the short run and the long run, because barriers stop new firms from competing it away.
Equilibrium
The monopolist produces Q, where MC = MR, and charges P, read from the demand curve above Q. The cost per unit is C, read from the ATC curve. The shaded rectangle is the abnormal profit.
Worked example. A monopolist's profit-maximising output is 2,000 units. At that output the price is Rs 50 and the average total cost is Rs 35.
Profit per unit = 50 − 35 = Rs 15.
Total abnormal profit = 15 × 2,000 = Rs 30,000.
The diagram is the same in the short run and the long run: high entry barriers prevent new firms from entering, so the abnormal profit stays. Because P is above MC, a monopoly is not allocatively efficient, and it does not produce at the lowest point of ATC, so it is not productively efficient either.
4. Monopolistic competition
These are industries with a fairly large number of firms, each producing a slightly different version of the same product. Branding and advertising are prominent. Clothing, restaurants, consumer electronics and hygiene products are typical examples.
Characteristics
- Many firms, though fewer than in perfect competition.
- Differentiated products: each firm's product is a close but not perfect substitute for the others.
- Low entry barriers. Barriers such as established brands exist, but new firms can overcome them.
- Some control over price. Product differences give each firm a downward-sloping demand curve, but close substitutes exist, so demand is more elastic (the curve is flatter) than a monopolist's. Firms are not price makers to the extent a monopoly is.
- Abnormal profit only in the short run. In the long run it falls to normal profit.
Short-run equilibrium
The diagram has the same parts as the monopoly diagram, with a flatter demand curve. The firm produces Q where MC = MR, charges P and earns abnormal profit (shaded), because P is above C.
Worked example. At the profit-maximising output of 2,000 units, the price is Rs 50 and ATC is Rs 35. Profit per unit is Rs 15, so abnormal profit is 15 × 2,000 = Rs 30,000.
Long-run equilibrium
Abnormal profit attracts new firms, and the barriers are low enough for them to enter. Each existing firm loses some customers to the newcomers, so its demand curve shifts to the left, from D to D1. Entry continues until the abnormal profit has gone.
In the long run the demand curve D1 is tangent to the ATC curve at the profit-maximising output, so P = ATC and the firm earns normal profit. This is the key difference from the short run, where the ATC curve lay below the demand curve at that output. The firm is still not efficient: P is above MC, and it produces less than the output at the lowest point of ATC (it has excess capacity).
5. Oligopoly
An oligopoly is an industry dominated by a few large firms, each supplying a big share of total market demand. Oil refining and distribution, telecommunications, airlines and cement are typical examples.
Characteristics
- A few large firms. Products may be identical (cement, petrol) or differentiated (cars, mobile networks).
- Interdependence. Each firm's best decision depends on what its rivals do, so every firm watches the others before changing its price.
- High entry barriers, above all the high investment requirement. Existing firms may raise barriers further, for example through predatory pricing.
- Price rigidity. Prices tend to stay where they are, which the kinked demand curve explains.
- An incentive to collude. With few firms, acting together like a single producer raises everyone's profit.
The kinked demand curve and price rigidity
A firm in an oligopoly considers two options from the current price P:
- Raise the price. Rivals will not follow, so the firm loses many customers to them. Demand above P is elastic, and total revenue falls.
- Cut the price. Rivals will match the cut to stay competitive, so the firm gains few customers and risks a price war. Demand below P is inelastic, and total revenue falls again.
Either move leaves the firm worse off, so the price stays at P: it is rigid. The demand curve has a kink at P.
Because the demand curve has a kink, the MR curve has a vertical gap at output Q. Profit is still maximised where MC = MR, and the MC curve passes through the gap. This means that costs can rise or fall within the gap without changing the profit-maximising price or output, which is a second reason for rigid prices. The shaded area is the abnormal profit, (P − C) × Q.
Since entry barriers are high, new firms do not enter in the long run, so the short-run and long-run equilibrium are the same and oligopoly firms can keep earning abnormal profit in both.
Collusion
Collusion is an agreement among firms to raise prices together, or to restrict their output, so that they all earn higher profits. The firms behave like a single producer (a monopoly). It is the way oligopoly firms escape price rigidity: they can all raise prices at once. There are two types:
- Cartel (explicit or formal collusion): firms formally agree to set prices and control their output. OPEC is the standard example. Cartels are illegal in most countries.
- Price leadership (implicit or tacit collusion): there is no written agreement; a dominant firm sets its price and the other firms follow.
Tacit collusion is safer for the firms, because it is harder for competition regulators to detect. But without a formal arrangement it is also easier for firms to cheat on each other.
6. Game theory and oligopoly
Game theory uses mathematical models to predict how the players in a "game" behave when the outcome for each one depends on what the others choose: situations of co-operation and conflict. It is widely used in economics and political science. To model any interaction you need three things:
- the players;
- the information and options (strategies) available to each player;
- the payoffs for each combination of options.
The prisoners' dilemma
Two suspects, Ali and Omer, are questioned separately. The police lack the evidence to convict them of the main crime unless one of them confesses. The payoff matrix shows the years each would spend in prison:
| Omer confesses | Omer stays silent | |
|---|---|---|
| Ali confesses | Ali 5 years, Omer 5 years | Ali 1 year, Omer 10 years |
| Ali stays silent | Ali 10 years, Omer 1 year | Ali 2 years, Omer 2 years |
Look at Ali's choice. If Omer confesses, Ali serves 5 years by confessing and 10 by staying silent. If Omer stays silent, Ali serves 1 year by confessing and 2 by staying silent. Confessing is better for Ali whatever Omer does: it is his dominant strategy. The same is true for Omer. So both confess and serve 5 years each, although both would have been better off staying silent and serving 2 years each. Lack of trust pushes the players to a worse outcome for both.
Should oligopoly firms raise their prices?
Firms in an oligopoly face the same situation as the prisoners. Two firms, A and B, each decide whether to raise their price. The payoffs are profits:
| Firm B raises its price | Firm B does not raise its price | |
|---|---|---|
| Firm A raises its price | A 7 million, B 7 million | A 3 million, B 10 million |
| Firm A does not raise its price | A 10 million, B 3 million | A 5 million, B 5 million |
- If both raise their prices, both earn higher profits (7 million each).
- But each firm does better by keeping its price low while the other raises it (10 million against 3 million), because it attracts the other firm's customers. Not raising the price is the dominant strategy for each firm.
- Without trust, neither raises its price, and both end up with 5 million: less than they could have earned together.
- If the firms sign a cartel agreement that fixes their prices, they both raise prices and both reach the 7 million outcome. This is why oligopoly firms have a strong incentive to collude, and also why every member of a cartel is tempted to cheat on it.
7. The four market structures compared
| Feature | Perfect competition | Monopolistic competition | Oligopoly | Monopoly |
|---|---|---|---|---|
| Number of firms | Very many | Many | A few large firms | One |
| Product | Identical | Differentiated | Identical or differentiated | Unique, no close substitutes |
| Entry barriers | None or low | Low | High | Very high |
| Control over price | None: price taker | Some | Considerable, but interdependent | Price maker |
| Firm's demand curve | Horizontal (perfectly elastic) | Downward sloping, elastic | Kinked | Downward sloping, less elastic |
| Short-run profit | Abnormal profit possible | Abnormal profit possible | Abnormal | Abnormal |
| Long-run profit | Normal | Normal | Abnormal | Abnormal |
| Examples | Wheat and other farm products | Clothing, restaurants | Oil, telecoms, airlines | Water, electricity and rail networks |
8. Check yourself
- Explain why a firm in perfect competition is a price taker.
- With the help of a diagram, explain why firms in perfect competition earn only normal profit in the long run.
- A monopolist sells 4,000 units at a price of Rs 120. Its average total cost at this output is Rs 95. Calculate its abnormal profit.
- Explain the difference between the short-run and long-run equilibrium of a firm in monopolistic competition.
- Use the kinked demand curve to explain why prices in an oligopoly tend to be rigid.
- Using the price matrix in section 6, explain why two firms without an agreement both end up with 5 million.
Answers in brief. 1: it supplies a tiny share of an identical product, so it cannot affect the market price; its demand is perfectly elastic. 2: abnormal profit attracts entry, supply shifts right, price falls until P = minimum ATC. 3: (120 − 95) × 4,000 = Rs 100,000. 4: short run P > ATC, abnormal profit; in the long run entry shifts the firm's demand left until it is tangent to ATC, so P = ATC and profit is normal. 5: a rise is not followed, so demand is elastic and revenue falls; a cut is matched, so demand is inelastic and revenue falls; the price stays at the kink, and MC can move within the gap in MR without changing price. 6: not raising the price is each firm's dominant strategy (10 beats 7, and 5 beats 3), so both keep prices unchanged.
